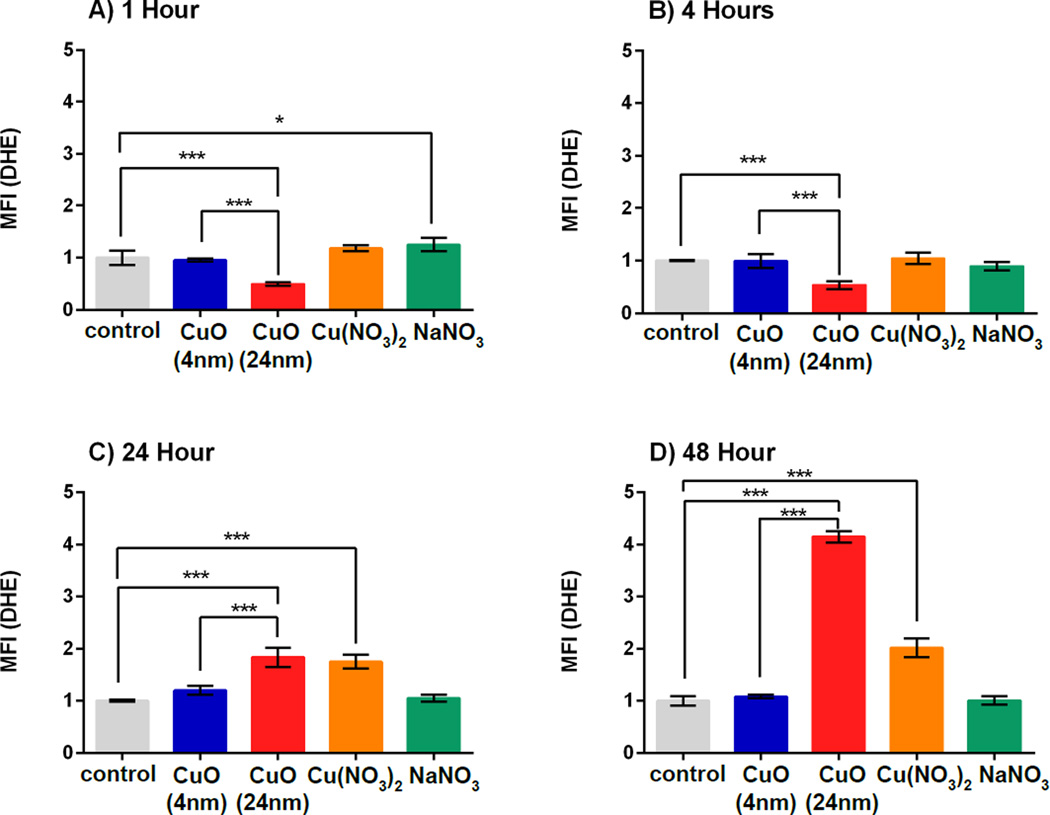
Figure 5. Intracellular pro-oxidants as detected by dihydroethidium oxidation (DHE).
Cells were incubated with small and large CuO NPs, Cu(NO3)2 and NaNO3 at a dose of 0.12 µM Cu2+ concentration(10 µg/ml CuO NPs) for 1 h (A), 4 h (B), 24 h (C) and 48 h (B). Antimycin A increased the MFI by 3- to 5-fold when compared to the control group (data not shown). MFI represents mean fluorescence intensity which was normalized to the control group. Data are expressed as mean ± SD (n = 3). One-way analysis of variance with Bonferroni’s multiple comparisons post-test was performed. *** p < 0.001, * p < 0.05.

