Figure 2.
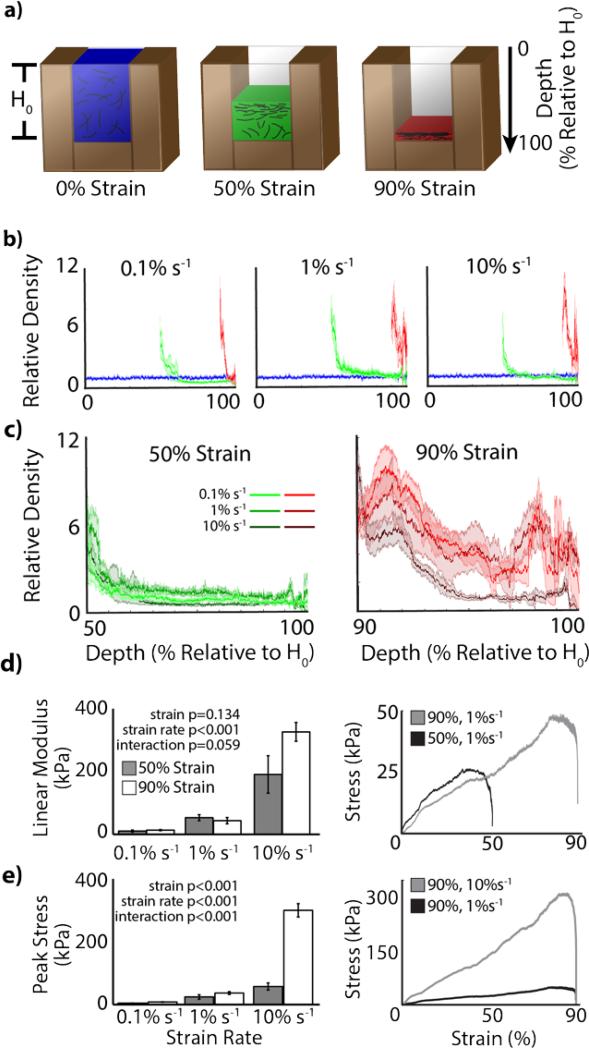
Quantitative analysis of collagen density gradients. a) All quantitative analysis was depicted respective to initial height and color coded, i.e. top of control = 0%, top of 50% strain samples = 50%, and top of 90% strain samples = 90%. b) Comparison across strain magnitudes showed an agreement of quantitative and qualitative analysis, i.e. higher density regions were achieved near the indented surface with a reduction in density toward the initial (control) density with distance along the height toward the bottom (mean±standard deviation). c) Comparison across strain rates (data replotted) showed little discernable difference between similar strain magnitudes. d) During the densification process, linear modulus of the loading regime depended on strain rate, but not strain magnitude. e) Peak stress depended on both strain magnitude and rate.

