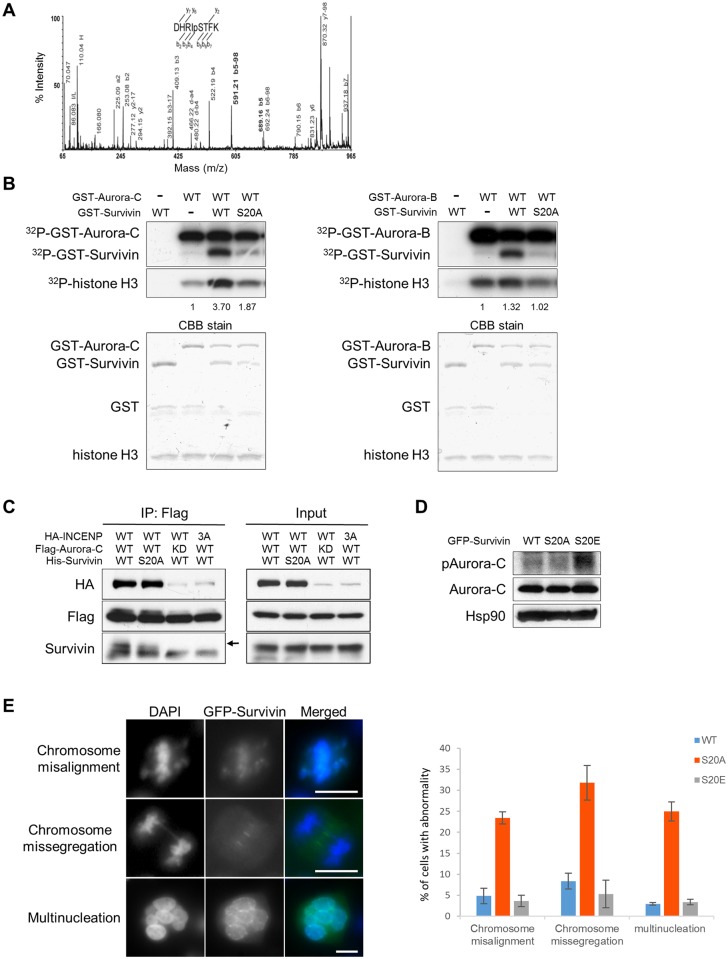
Fig 6. Aurora-C phosphorylates Survivin on Serine 20.
(A) Fragmentation of DHRIpSTFK on the TofTof. Inset summarizes ions found. A key ion is the b5, mainly observed as the -98 neutral-loss ion (loss of phosphoric acid), indicating it as the primary site of phosphorylation. Essentially complete sequence ion coverage was observed considering both “b” and “y” type ions. Detection of the Ile-specific d4 fragment ions provides confirmation that the overall sequence assignment is correct. (B) Sf-9 cells were co-infected with GST-Survivin WT or S20A mutant and GST-Aurora-C WT or KD (left panel) or GST-Aurora-B WT or KD (right panel). 48 h after infection, proteins were isolated on glutathione sepharose, co-precipitated GST-Aurora-C, GST-Aurora-B, and GST-Survivin were incubated with [γ32P]-ATP and histone H3 as substrate. The reactions were resolved by SDS-PAGE and visualized by autoradiography (top) or CBB stained (bottom). Relative [γ32P]-ATP incorporation to histone H3 shown was normalized by total histone H3 and quantified by ImageJ software. Experiments were repeated three times and showed reproducible results. (C) 293T cells were co-transfected with HA-INCENP, Flag-Aurora-C, and His-Survivin plasmids respectively. 24 h after transfection, cells were lysed and immunoprecipitated by anti-Flag antibody. Immunoprecipitates were immunoblotted with indicated antibodies. Arrow indicates slower mobility sift band of Survivin. (D) HeLa cells stably expressing GFP-Survivin WT, S20A, or S20E mutant were treated with 40 ng/ml nocodazole for 16 h. Cells were lysed and immunoblotted with indicated antibodies. (E) Analysis of cellular and mitotic defects in HeLa cell clones stably expressing GFP-Survivin WT, S20A, or S20E mutant. Representative images of GFP-Survivin S20A expressing cells with abnormal chromosome alignment, abnormal chromosome separation, and multinucleation are shown on the left. Green fluorescence shows distribution of Survivin and DNA is stained with DAPI (blue). The percentages of chromosome misalignment, chromosome missegregation, and multinucleated giant abnormal cells in the indicated transfected clones are shown in the bar graph on the right. At least 200 cells in each of the clones were analyzed for this assay. Data represent mean values ± SD from two clones (n = 2). Scale bar indicates 10 μm. Experiments were repeated twice with two biological replicates in each experiment. Figures show the representative images.

