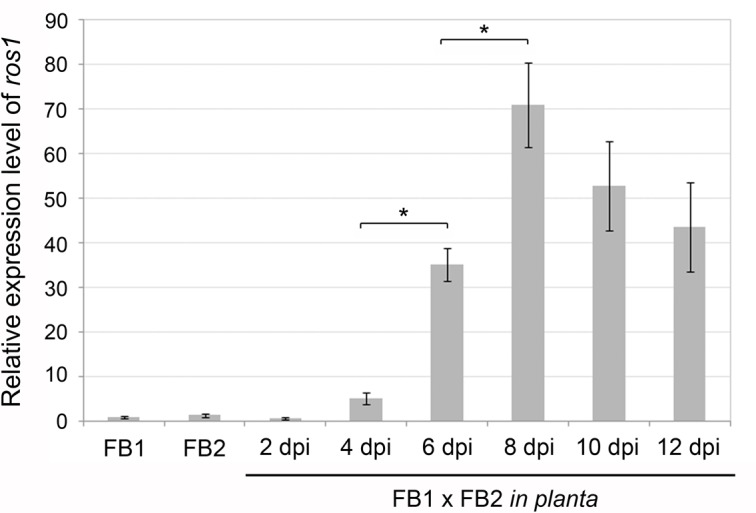
Fig 3. ros1 is upregulated late after infection.

qRT-PCR analysis of ros1 expression in FB1 and FB2 grown in YEPSL or during plant infection (FB1 x FB2). Axenic culture samples were collected at OD600 = 1.0. Infected plant samples were collected at the time-points indicated below. qRT-PCR analysis was performed using the constitutively expressed ppi gene (UMAG_03726) for normalization. Relative expression was determined using the ΔΔCt method. Values shown are means of three biological replicates. Bars indicate the standard deviation between biological replicates. Asterisks indicate significant differences (paired t-test, p ≤ 0.05).
