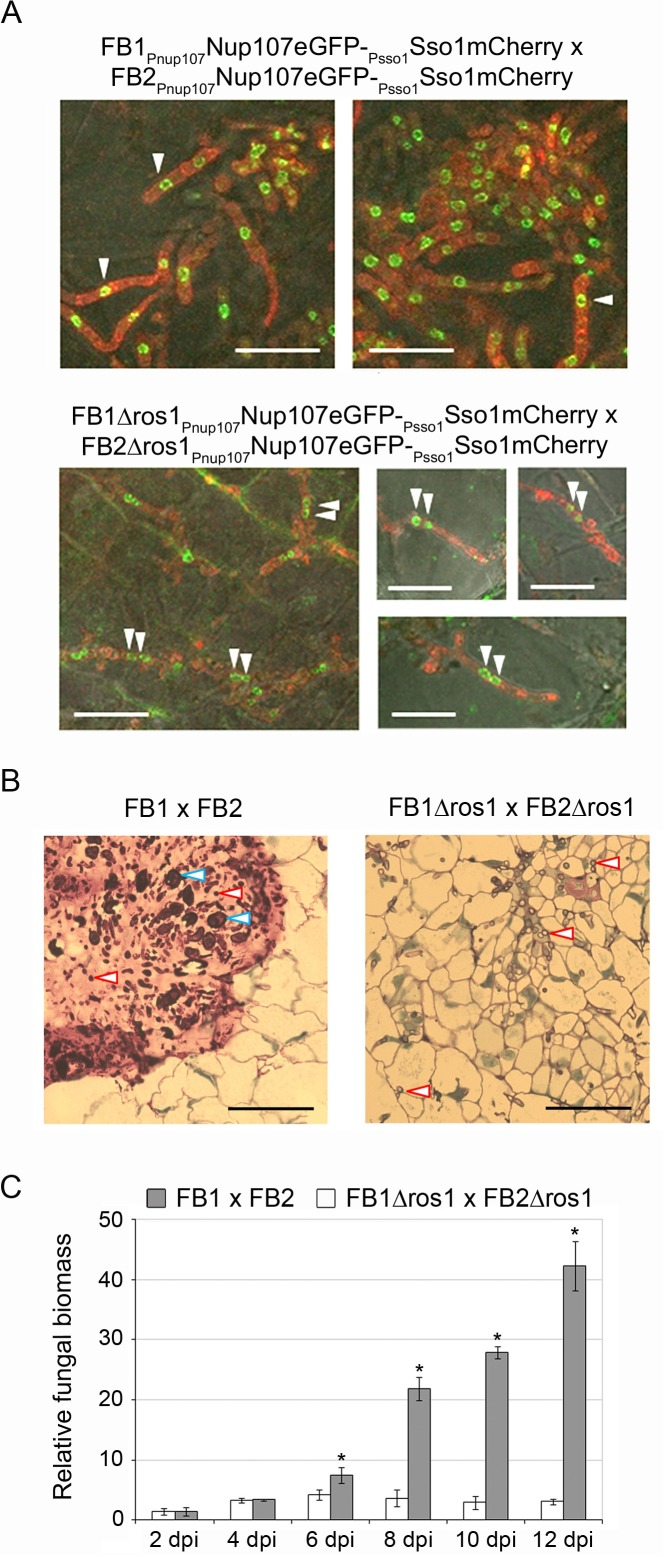
Fig 4. Ros1 is required for karyogamy, matrix formation and biomass increase.
(A) Visualization of fungal nuclei. Nuclear status of biotrophic hyphae was assessed by imaging fungal nuclei inside hyphae in tumor tissue. Maize seedlings were infected with a combination of FB1Pnup107Nup107eGFP-Psso1Sso1mCherry x FB2Pnup107Nup107eGFP-Psso1Sso1mCherry or FB1Δros1Pnup107Nup107eGFP-Psso1Sso1mCherry x FB2Δros1Pnup107Nup107eGFP-Psso1Sso1mCherry expressing both the nuclear envelope marker Nup107eGFP (green fluorescence) and the membrane marker Sso1mCherry (red fluorescence). Tumor samples were collected between 6 and 8 dpi and analyzed by confocal microscopy. Only one nucleus is visible in hyphae of FB1Pnup107Nup107eGFP-Psso1Sso1mCherry x FB2Pnup107Nup107eGFP-Psso1Sso1mCherry (upper panel) while FB1Δros1Pnup107Nup107eGFP-Psso1Sso1mCherry x FB2Δros1Pnup107Nup107eGFP-Psso1Sso1mCherry hyphae are dikaryotic (lower panel). White arrows indicate the position of nuclei. Bar = 10 μm. (B) Staining of the mucilaginous matrix. Leaf tumors from maize seedlings infected with the indicated strains were collected at 10 dpi. Samples were fixed and embedded in Epoxy resin. 1–2 μm thick sections were generated and stained with methylene blue-azure II-basic fuchsin. The mucilaginous matrix appears in pink in the FB1 x FB2 infection while no matrix is visible in the tissue infected by FB1Δros1 x FB2Δros1. Blue arrowheads indicate maturing spores, red arrowheads indicate fungal hyphae. Bar = 50 μm. (C) Fungal biomass increase during plant infection. Plants were infected with the indicated strains and samples were collected at 2, 4, 6, 8, 10, and 12 dpi. Relative fungal biomass (grey columns FB1 x FB2; white columns FB1Δros1 x FB2Δros1) was determined by qRT-PCR using U. maydis-specific and maize-specific primers. Columns give mean ratios of fungal DNA to plant DNA from three independent experiments. The ratio in FB1 x FB1 infected plants at 2 dpi was set to 1.0. Error bars indicate standard deviation. Asterisks indicate significant differences (t-test, p ≤ 0.05).

