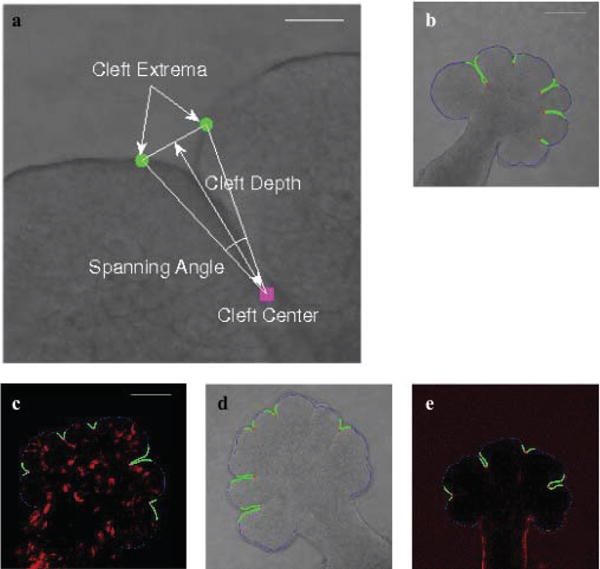
Fig. 2.

Characterization of clefts and sample results of the cleft detection algorithm. The figure shows cleft extrema (marked in green) and cleft center (marked in maroon) points that characterize the cleft in (a) (Scale, 50 μm). Spanning angle and cleft depth are calculated from these points as illustrated. In (b)–(e) (Scale, 100 μm), results of applying the cleft detection algorithm to four different data sets is shown. The cleft regions are highlighted in the DIC microscopy ((b) and (d)), GFP-labeled (c), and FN-labeled (e) images. The cleft centers are highlighted in red (or maroon in (c)) and the cleft regions are marked in green.
