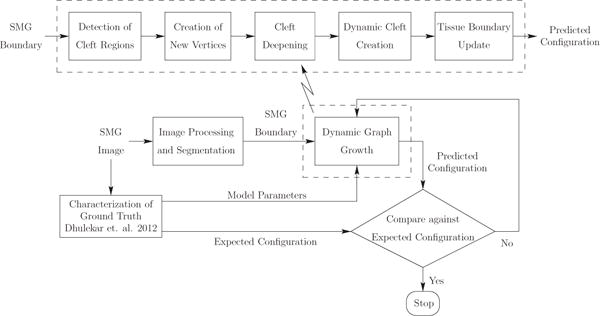
Fig. 3.

Overview of dynamic graph-based growth model. We start with acquisition of the biological data that gives us the SMG images. We then quantify the biological data by identifying clefts and computing global tissue-scale morphological features and local features. We run our dynamic graph-based growth model with the model parameters computed from the biological data as shown in the figure. Termination is based on reaching the optimal iteration that minimizes the distance to the target configuration.
