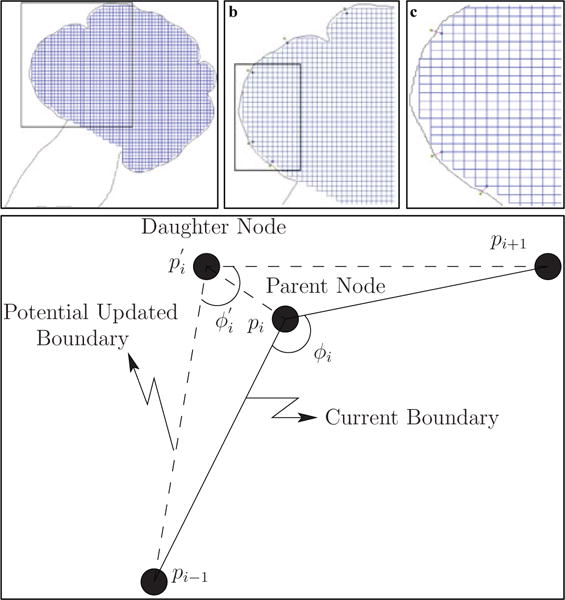
Fig. 4.

Creation of new vertices and maintaining boundary smoothness. The configuration of the cell-graph (initially a grid-graph where vertices are found at the intersection of the grid lines, and the grid lines are the edges of the graph) after a single iteration of creation of new vertices (step 2 of the dynamic graph-based growth algorithm) is shown in (a). The black rectangle in (a) represents the closer snapshot of the sub-graph viewed in (b). A further black rectangle in (b) represents a smaller sub-graph shown in (c). The spatial positions of parent vertices in the current boundary are used to identify the optimal location for daughter vertices, as shown in (d). The uniformity in the grid-graph is distorted with every iteration of the dynamic graph-based growth algorithm.
