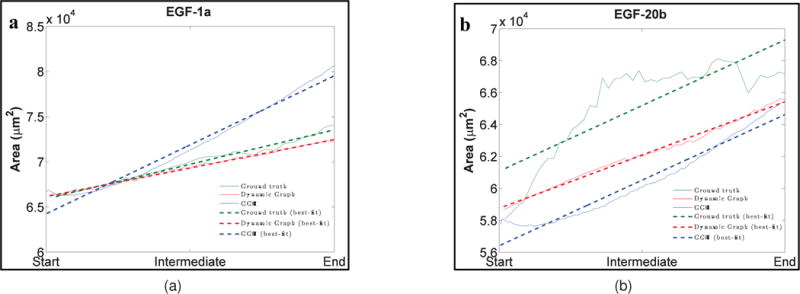
Fig. 7.

Comparison of SMG morphological features between ground truth (green), dynamic graph-based growth model (red), and the GGH simulation (blue) for EGF-1a and EGF-20b data sets. The features are area (a) and (b), perimeter (c) and (d), eccentricity (e) and (f), and median cleft depth (g) and (h). “Start” refers to cleft initiation, “Intermediate” refers to mid cleft progression stage, and “End” refers to beginning of cleft termination. Area and perimeter display increasing trends and similar trends are also seen for the dynamic graph model as well as the GGH simulation. GGH shows the opposite trend for eccentricity as it tries to create circular shapes. Increasing median cleft depth trends are shown by both dynamic graph model and the GGH simulation. For more detailed explanation of the feature trends, please refer to Section 3.3.
