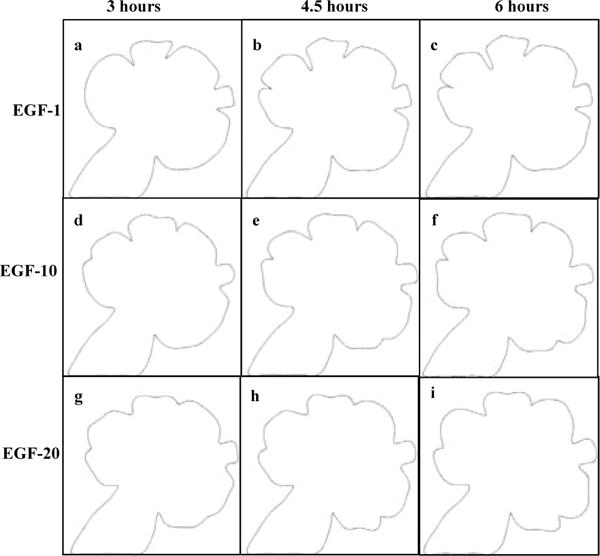
Fig. 9.

Dynamic graph-based prediction model results. Same starting image grown under different EGF concentrations for 3, 4.5, and 6 hours. The configuration of the salivary gland after 3 hours under EGF-1, EGF-10, and EGF-20 concentrations are shown in (a), (d), and (g), respectively. The configuration of the salivary gland after 4.5 hours under under the same concentrations are shown in (b), (e), and (h), respectively. The configuration of the salivary gland after 6 hours under the same concentrations are shown in (c), (f), and (i), respectively. The number of buds increases from EGF-1 to EGF-20, with clefting occurring more frequently in higher EGF concentrations. Buds are larger and clefts are deeper in lower EGF concentrations. Please recall that we do not compare the prediction model to a Monte-Carlo-based simulation (MCS) model. For further information about the prediction model, please refer to Section 3.4
