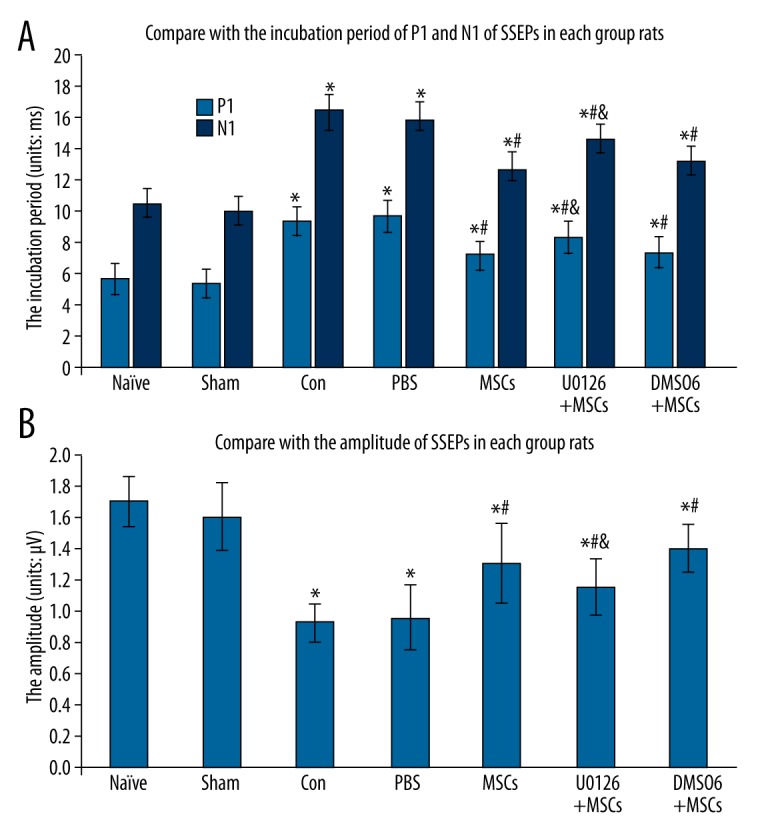
Figure 3.

Effect of intrathecal transplantation of MSCs to SSEPs in rats following spinal cord ischemia-reperfusion injury. (A) The statistical analysis of the incubation periods of the P1 and N1 of SSEPs in every group. (B) The statistical analysis of the amplitude of SSEPs in every group. Data are shown as the mean ±SEM (n=8). * P<0.01, vs. naïve group, # P<0.01 vs. con group, & P<0.01, vs. MSCs group.
