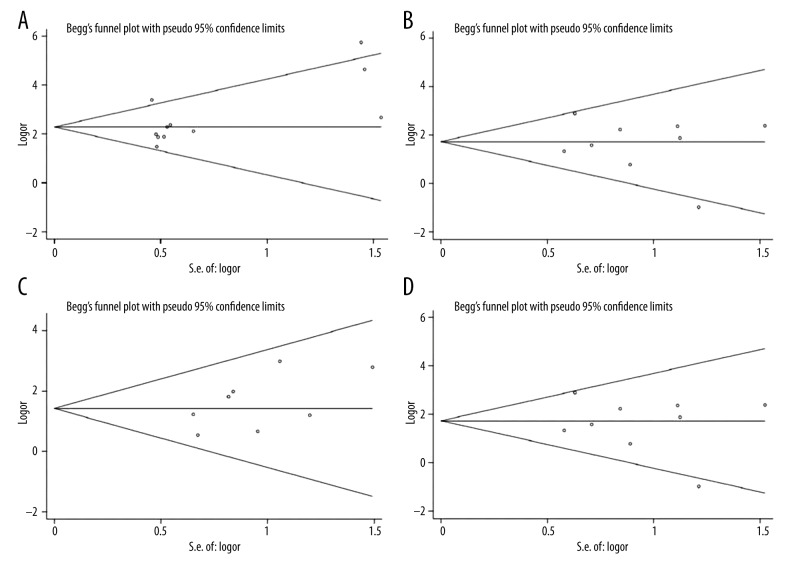
Figure 8.
(A) Begg’s publication bias plot of publication bias for studies regarding overexpressed DcR3 and female reproductive cancers risk in the meta-analysis. (B) Begg’s publication bias plot of publication bias for studies regarding overexpressed DcR3 and TNM stage in the meta-analysis. (C) Begg’s publication bias plot of publication bias for studies regarding overexpressed DcR3 and differentiation in the meta-analysis. (D) Begg’s publication bias plot of publication bias for studies regarding overexpressed DcR3 and lymph node metastasis in the meta-analysis.

