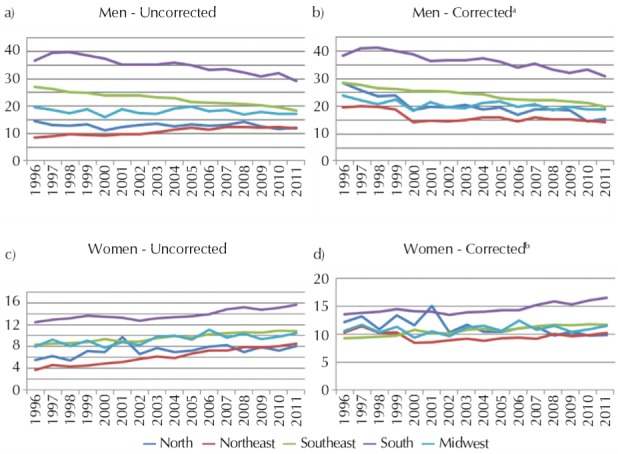
Figure. Lung cancer mortality trends according to sex and geographic regions. Brazil, 1996-2011.

a Slope and p (in parentheses) value for corrected data: North: -0.706 (0.000), Northeast: -0.325 (0.016), Southeast: -0.531 (0.000), South: -0.607 (0.000), Midwest: -0.204 (0.002).
b Slope and p (in parentheses) value for corrected data: North: -0.213 (0.000), Northeast: -0.022 (0.726), Southeast: 0.175 (0.000), South: 0.177 (0.002), Midwest: 0.041 (0.207).
