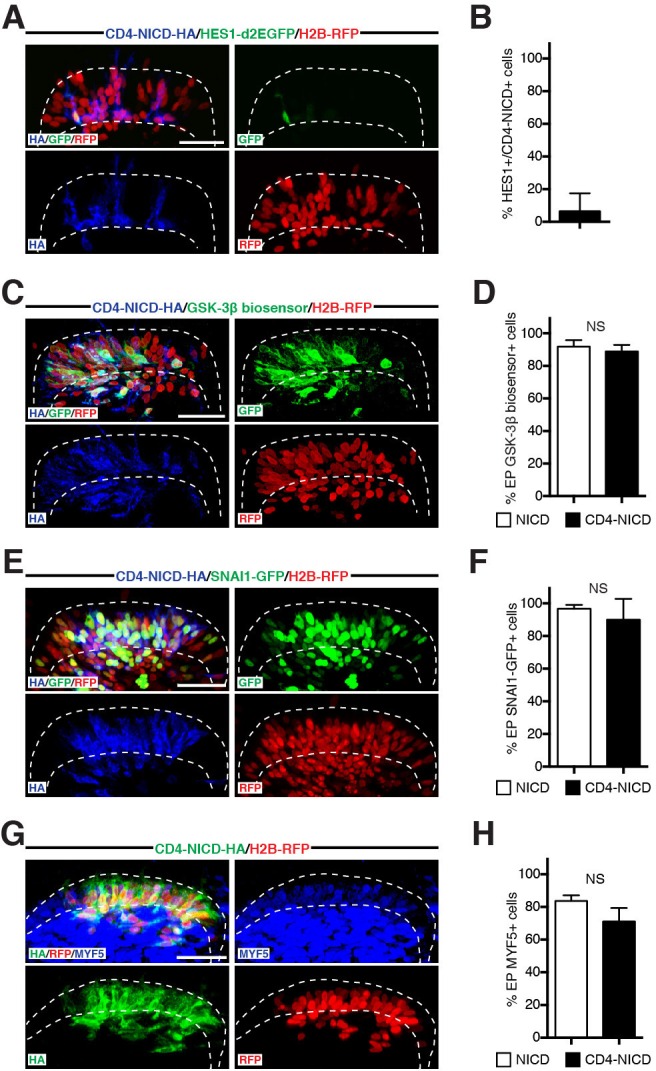
Figure 9. NOTCH1 controls myogenesis independently of its transcriptional role in the nucleus.

(A) Confocal stacks of somites, 6 hr after co-electroporation of a HA-tagged, membrane-tethered NICD, CD4-NICD (in blue), a NOTCH reporter (in green) and H2B-RFP (in red). (B) Bar charts showing 6.4% of NOTCH reporter-positive cells electroporated with CD4-NICD. (C) Confocal stacks, 6 hr after electroporation of CD4-NICD (in blue), GSK-3β biosensor (in green) and H2B-RFP (in red). (D) Bar charts showing the percentage of GSK-3β biosensor-positive cells after electroporation with NICD (91.6%, in white) or with CD4-NICD (88.6%, in black). (E) Confocal stacks, 6 hr after co-electroporation of CD4-NICD (in blue), SNA1-GFP (in green) and H2B-RFP (in red). (F) Bar charts showing the percentage of SNAI1-GFP-positive cells after electroporation with NICD (96.7%, in white) or with CD4-NICD (90%, in black). (G) Confocal stacks, 6 hr after co-electroporation of CD4-NICD (in green), H2B-RFP (in red) and immunostained for MYF5 (in blue). (H) Bar charts showing the percentage of MYF5-positive cells after electroporation with NICD (83.7%, in white) or with CD4-NICD (71.1%, in black). In each panel are indicated the antigens that were detected by immunostaining. Abbreviation: EP: electroporation. Scale bars: 50 μm
