. 2016 Jun 3;5:e15716. doi: 10.7554/eLife.15716

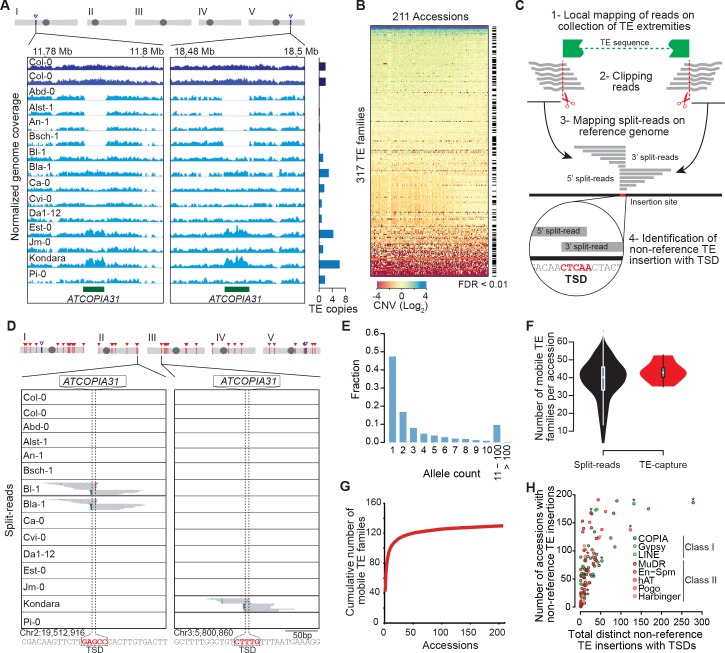
Figure 1. Overview of the A. thaliana mobilome.

(A) Genome browser tracks showing normalized sequencing coverage over the two full-length ATCOPIA31 elements annotated in the reference genome (Col-0). CNV is detected as increased or decreased coverage in other accessions. Number of copies is indicated on the right. (B) Heat map representing CNVs (log2 ratio) for 317 TE families and 211 A. thaliana accessions. TE families with statistically significant CNV in at least one accession are indicated. Figure 1—source data 1 contains absolute copy number estimation of TE sequences. (C) Schematic representation of the bioinformatics pipeline to identify non-reference TE insertions with TSD using split-reads. 1- Reads are mapped on a collection of TE extremities from annotated TE sequences and reference sequences (Repbase update). 2- Reads aligning partially over TE extremities are extracted and clipped. 3- The unmapped portion of these split-reads are re-mapped on the Arabidopsis reference genome. 4- Non-reference TE insertions with TSDs are identified by searching for overlapping clusters of 5’ and 3’ split-reads. (D) Genome browser tracks showing split-reads for two non-reference ATCOPIA31 insertions and TSD reconstruction. Figure 1—source data 2 contains the coordinates of all non-reference TE insertions with TSDs. (E) Distribution frequency of allele counts for non-reference TE insertions with TSDs. (F) Number of mobile TE families per accession identified using split-read and TE-sequence capture. (G) Cumulative plot of the number of mobile TE families detected with increasing numbers of accessions. (H) The total number of non-reference TE insertions with TSDs is indicated in relation to the number of accessions with such insertions, for each of the 131 mobile TE families. Asterisks indicate the nine TE families with experimental evidence of transposition (Ito and Kakutani, 2014; Tsay et al., 1993). Figure 1—source data 3 contains the total number of distinct non-reference TE insertions with TSD for each TE family and super-family. Figure 1—figure supplement 2 shows TE-capture results. Figure 1—figure supplement 1 contains IGV screenshots showing the pattern of split-reads characteristic of true- and false-positive non-reference TE insertions with TSDs.

DOI: http://dx.doi.org/10.7554/eLife.15716.002

Figure 1—source data 1. Copy number estimation of TE sequences.
(A) Copy number estimation based on read coverage for the 317 TE families analyzed across 211 A. thaliana accessions collected worldwide. Column descriptions are provided in (B).
elife-15716-fig1-data1.xlsx (614.3KB, xlsx)
DOI: 10.7554/eLife.15716.003
Figure 1—source data 2. Coordinates of non-reference TE insertions with TSDs.
(A) Coordinates and presence or absence call (1 and 0, respectively) across the 211 A. thaliana accessions. Description of columns is provided in (B).
DOI: 10.7554/eLife.15716.004
Figure 1—source data 3. Number of distinct non-reference TE insertions with TSDs identified by the split-reads approach for each TE family and super-family.
DOI: 10.7554/eLife.15716.005
Figure 1—source data 4. TE insertions with TSDs present in Col-0 but absent in Ler-1.
(A) Genomic coordinates of the insertion in Col-0 and of the corresponding empty site in Ler-1. Description of columns is provided in (B).
elife-15716-fig1-data4.xlsx (369.9KB, xlsx)
DOI: 10.7554/eLife.15716.006

Figure 1.

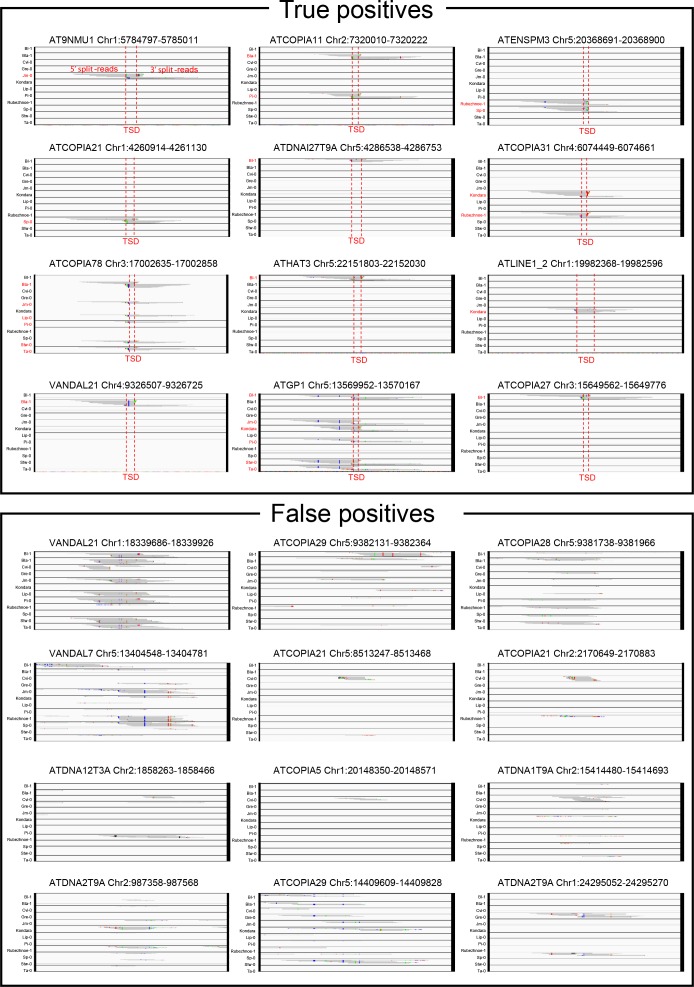
Figure 1—figure supplement 1. Visual inspection of true- and false-positive non-reference TE insertions with TSDs.

Figure 1—figure supplement 1.

IGV screenshots showing split-reads for non-reference TE insertions with TSDs that are validated or not by TE-capture (true- and false-positives, respectively). Split-reads are shown for 12 different accessions. Accessions containing the non-reference TE insertion with TSD are indicated in red.
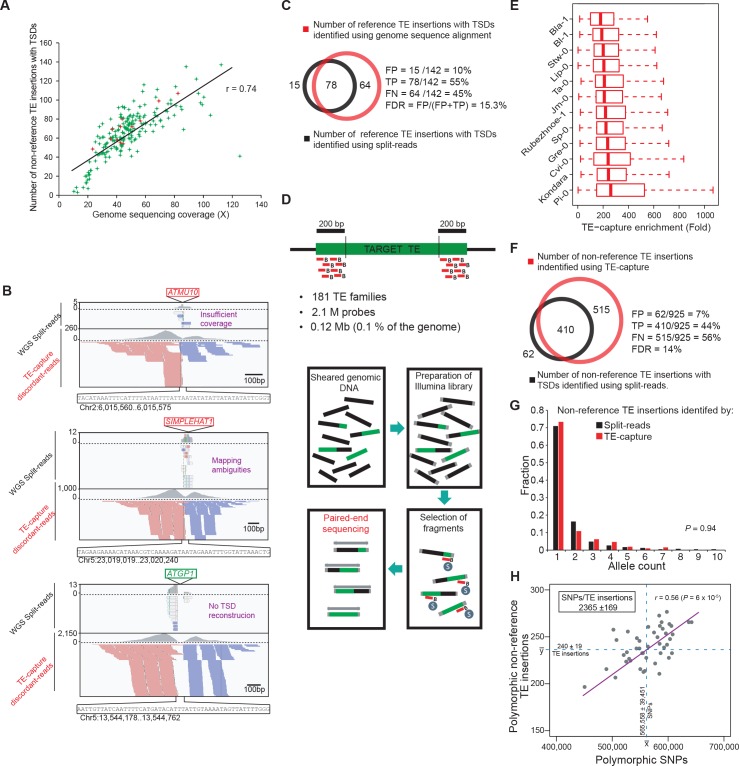
Figure 1—figure supplement 2. Validation of the A. thaliana mobilome by TE-capture.

Figure 1—figure supplement 2.

(A) The number of non-reference TE insertions with TSDs identified by the split-read pipeline is plotted against the corresponding genome sequencing coverage for each accession. Accessions analyzed by TE-capture are highlighted in red. (B) Genome browser tracks showing examples of non-reference TE insertions identified by TE-capture only. (C) Overlap between TE insertions with TSDs identified specifically in Col-0 using the Ler-1 genome assembly as a reference and either whole genome sequence alignment or the split-reads pipeline. The percentage of false positives (FP), true positives (TP) and false negatives (FN) as well as the false discovery rate (FDR) are indicated. (D) Description of the TE-capture design and workflow. (E) TE-capture enrichment of target sequences. (F) Overlap between non-reference insertions with TSDs identified by split-read analysis and TE-capture. The percentage of FP, TP and FN as well as the FDR are indicated. (G) Distribution frequency of allele counts for non-reference TE insertions identified using the split-read approach and TE-capture among the 12 accessions analysed. (H) Number of SNPs plotted against the number of non-reference TE insertions identified by TE-capture between any two accessions.