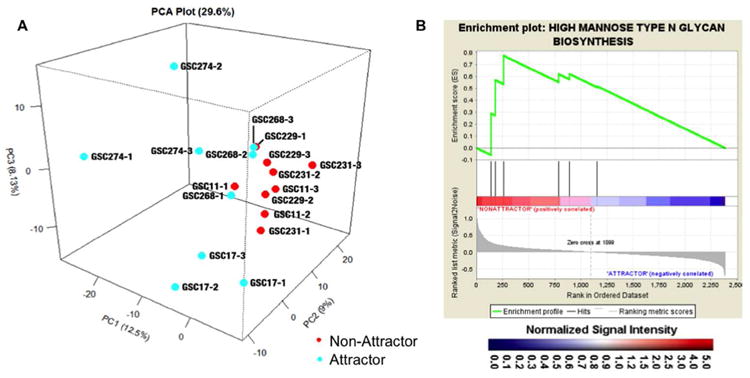
Figure 2. Targeted transcriptomic analysis.

(A) Principal component analysis of all human glycogenes from targeted microarray. Attractors are in blue while non-attractors are shown in red. GSC followed by a number designates the glioma stem cell line used for the xenograft and the number following the hyphen indicates the biological replicate. (B) GSEA enrichment plots for statistically significant genes. The high mannose N-glycan type glycogene set enriched in the non-attractor phenotype is depicted. Black bars illustrate the position of the probe sets in the context of all of the glycoprobes on the array. The running enrichment score plotted as a function of the position of the ranked list of array probes is shown in green. The rank list metric shown in gray illustrates the correlation between the signal-to-noise values of all individually ranked genes according to the class labels (attractor vs non-attractor). The genes overrepresented on the leftmost side of the enrichment plots are those that correlate to differential expression in the non-attractor phenotype. Significantly enriched data sets are defined at a p < 0.05 and a false discovery rate (FDR) < 0.30.
