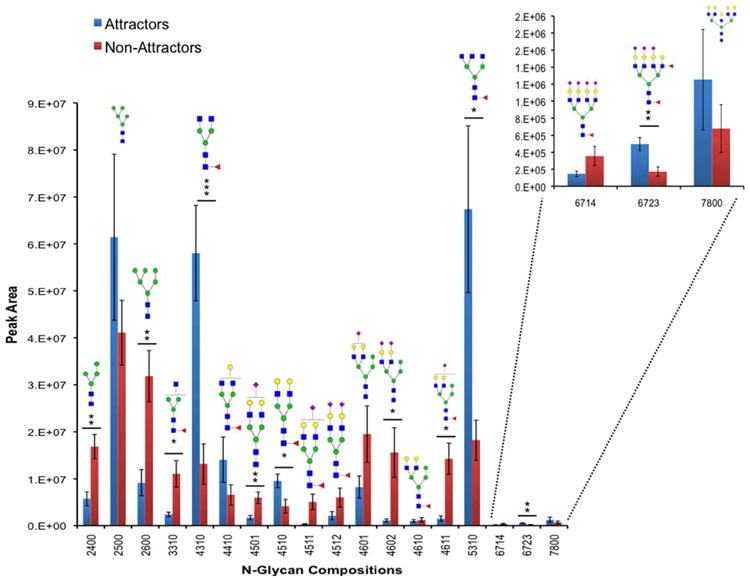
Figure 3. N-glycan Compositions in Attractors and Non-Attractors.

Bar graphs of the permethylated N-glycan peak from attractor (blue) and non-attractor (red) GSCXs through on-tissue (tumor) digestions. The y-axis represents peak area and the x-axis represents glycan compositions (GlcNAc, Man, Gal, Fuc, NeuNAc). Symbols; GlcNAc, blue squares; Man, green circles, Gal, yellow circles, NeuNAc, magenta diamonds, and Fuc red triangles. Values are mean ± SEM; * p < 0.05, ** p < 0.01, and *** p < 0.001 (Student's t-test).
