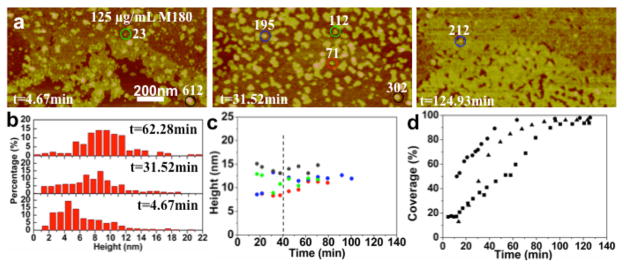
Figure 3.
In situ AFM images and height distributions of the second layer of rp(H)M180 adsorbed onto HAP (100) at different time points: (a) [rp(H)M180] = 125 μg/mL. (b) Height distribution of particles in the second layer in (a). (c) Height evolution of circled particles in corresponding colors in (a). (d) Kinetics of the second-layer areal coverage at 125 (squares), 200 (triangles), and 250 μg/mL (circles) protein concentrations. Several adsorbates are labeled by their monomer number in white.

