. 2016 Jun 17;16(3):189–194. doi: 10.4110/in.2016.16.3.189

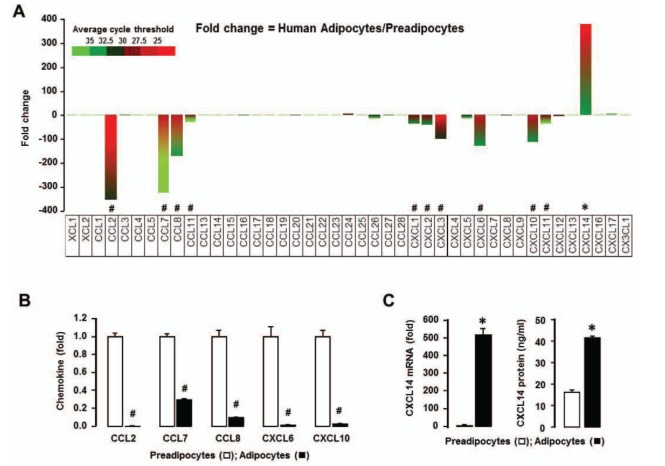
Figure 2. Chemokine ligand signature in human preadipocytes and adipocytes. (A) Comparison of chemokine ligands in preadipocytes and adipocytes using PCR array containing complementary sequences for human chemokine ligand genes. Different colors indicate the average cycle threshold with expressions that ranged from >35 to <25. Expression levels of chemokines were defined as absent (>35), low (30-35) and high (<30) on average threshold cycles. Chemokines with a >2-fold increase (*) or decrease (#) were recognized as the major differences between preadipocytes and adipocytes. (B) Changes in mRNA expression of CCL2, CCL7, CCL8, CXCL6, CXCL10 and (C) CXCL14 were confirmed using specific PCR primer sets by qRT-PCR. Fold changes were calculated as a relative value after setting the first sample of adipocytes as a control group (1.0). Also, secreted CXCL14 in conditioned media from preadipocytes and adipocytes was assessed by ELISA. Experiments values for PCR array are the means from duplicate experiments, while experiments for qRT-PCR were performed at least in triplicate. All data value are presented as mean±SEM. * and # indicates significant increase or decrease (p≤0.05), respectively when tested with Student's t test.

Figure 2