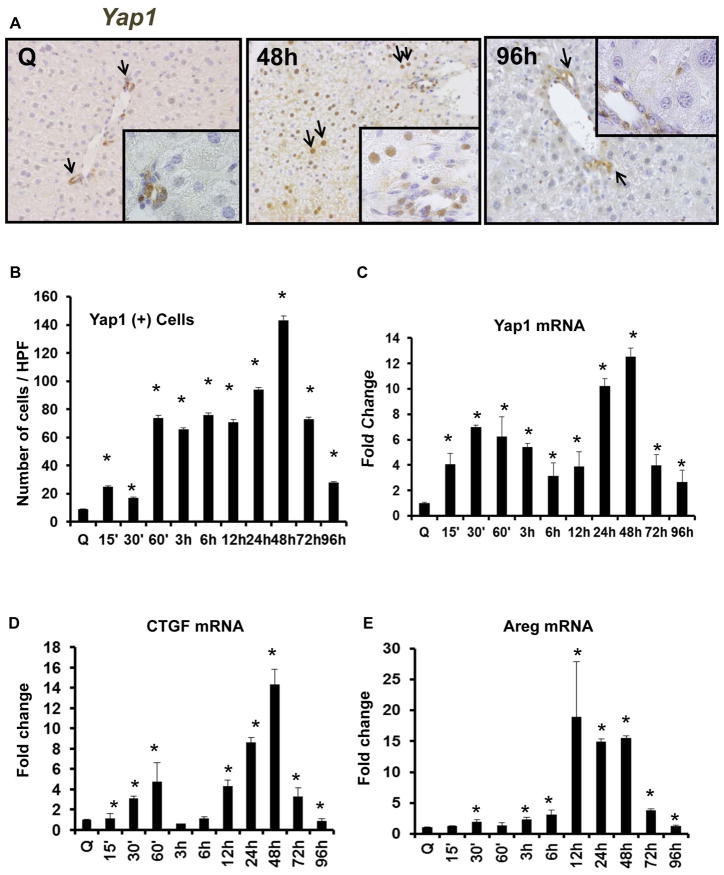
Figure 3. Yap1 and Yap1-target genes are upregulated after PH.
Wild type (WT) mice underwent PH. Whole livers were harvested for immunohistochemistry and qRT-PCR. (A) Representative Yap1 immunostaining in quiescent (Q) liver and at 48 and 96 h post-PH. Black arrows refer to Yap1 (+) cells. Inserts show YAP1 (+) ductular and hepatocytic cells. (B) Yap1 quantification. Results were expressed as mean ± SEM number of cells per high-powered field (HPF). (C) YAP1 mRNA, (D) CTGF mRNA, and (E) AREG mRNA; results were expressed as fold change relative to quiescent (time 0) livers; mean ± SEM were graphed. *p<0.05 vs. time 0.

