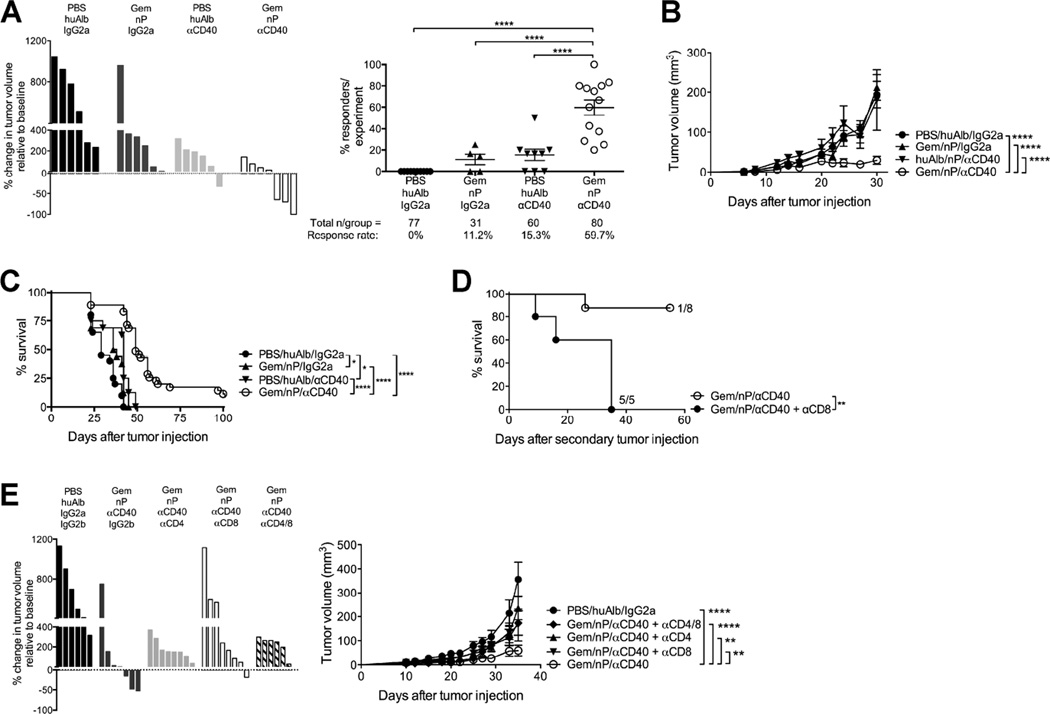
Figure 1. Gem/nP/αCD40 drives T cell-dependent regressions of PDA.
Mice were injected with PDA 4662 cells subcutaneously and after 12 days of growth, tumors were treated with Gem/nP followed by αCD40 2 days later.
(A) Left, change in tumor volume on day 24 compared to start of treatment (day 12), representative of 7 independent experiments. Right, the total proportion of regressors/experiment, from 13 individual experiments, total number of mice/group shown below.
(B) Tumor growth kinetics for mice from (A).
(C) Survival curve for mice treated as described in (A), from 2 combined experiments.
(D) Survival after second tumor injection >60 days after primary tumor injection. Some mice received αCD8, representative of 2 independent experiments.
(E) Mice were treated as described in (A), and with αCD4 and/or αCD8. Left, change in tumor growth compared to baseline, right, tumor growth kinetics. Data are representative of 3 independent experiments.
Each experiment had 4–10 mice/group, each bar represents a single mouse and each symbol represents a group, horizontal line and error bars indicate mean ± SEM. Statistical analyses by one-way ANOVA (A), two-way ANOVA with Tukey’s HSD post-test (B, E), or Log-rank test (C, D). See also Figure S1, S2.

