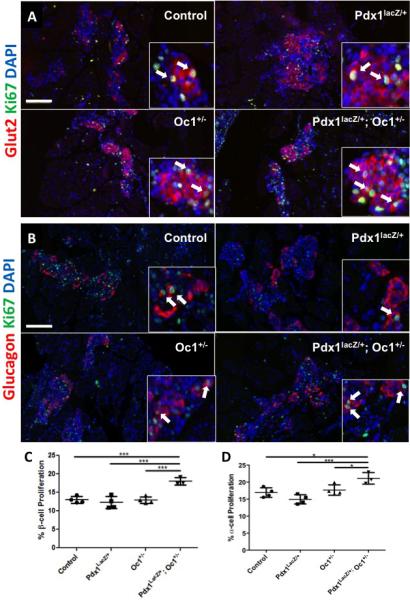
Figure 6. Increased α- and β-cell proliferation at e18.5 in DH pancreata.

Representative images of proliferating β cells (A; red: Glut2, green: Ki67) and α-cells (B; red: glucagon, green: Ki67) at e18.5. α-cell Proliferation at e18.5. Arrows point to proliferating hormone+ cells. (C) quantification of β-cell proliferation, (D) quantification of α-cell proliferation. Scale bar = 100μm; *: p<0.05; ***: p<0.001.
