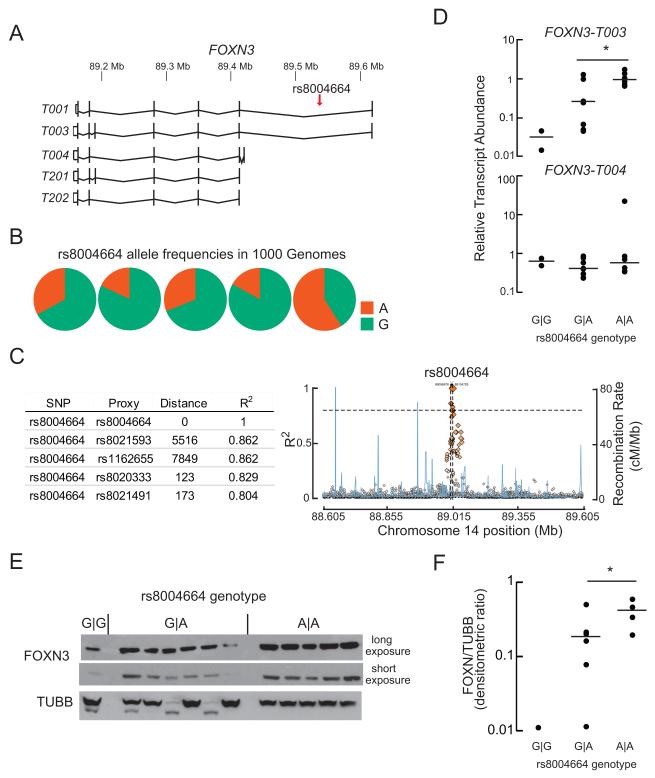
Figure 1. The rs8004664 risk allele increases FOXN3 gene expression.
(A) The 514.28kb FOXN3 locus is on the reverse strand of human chromosome 14. The -003 transcripts variant encodes the full-length protein. Four other major, protein-coding transcript variants are annotated in GENCODE 24. Note the location of rs8004664, within the first, large intron. Transcript variant -T001 encodes a 468-aminoacyl residue (aa) protein; -T003 encodes a 490 aminoacyl residue (aa) protein; -T004 encodes a 468aa protein; -T201 encodes a 490aa protein; and -T202 encodes a 468aa protein.
(B) Allele frequencies in the 1000 Genomes dataset. ‘A’ is the hyperglycemia risk allele. The overall minor (risk) allele frequency is 30%.
(C) The distance in base pairs of the nearest SNPs in linkage disequilibrium to rs8004664 are shown in the table (left). Linkage disequilibrium (R2 values) and recombination rate (cM/Mb) plots for the 10 kb flanking the rs8004664 are shown for the entire 1000 Genomes data set (plotted with SNAP). Note the chromosomal position of rs8004664 is different from that shown in A because different builds of the human genome were queried.
(D) Steady-state transcript abundance of FOXN3-T003 and -T004 in cryopreserved human hepatocytes from donors with the indicated rs8004664 genotypes, G∣G (n=2), A∣G (n=8), and A∣A (n=6). Horizontal lines indicate the median value. Transcript variants -T003 is the most abundant, followed by -T004. Mean ± s.e.m. values are shown. Ct = 26.9 ± 0.3 for –T003 and 31.7 ± 0.4 cycles for –T004. *P = 0.03; two-tailed Student’s t-test.
(E, F) Sufficient protein was retrieved from 12 of the 16 donor liver samples analyzed in panel D for immunoblot analysis. FOXN3 protein showed a similar trend as FOXN3 transcript, with increasing abundance proportional to the number of rs8004664 risk alleles present. Horizontal lines indicate the median value. *P = 0.06; two-tailed Student’s t-test. TUBB, β-Tubulin) See also Figure S1 and Table S1.

