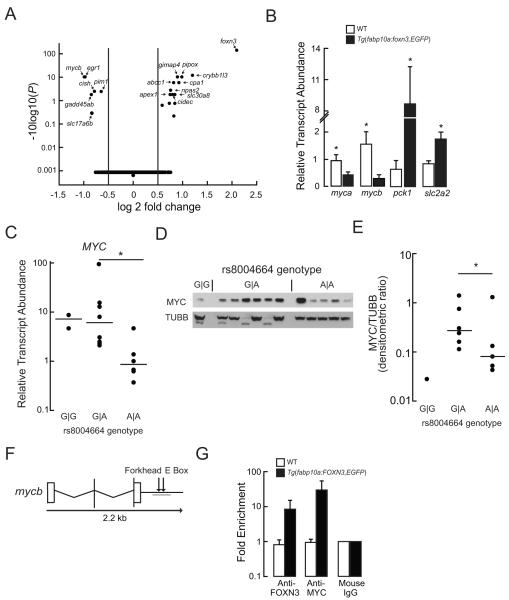
Figure 4. FOXN3 Suppresses MYC Expression.
(A) Volcano plot of differentially expressed transcripts from the RNA pools (n = 3) extracted from the livers of never-fed WT and Tg(fabp10a: foxn3,EGFP)z106 larvae. Note the adjusted P values are plotted on a log base 10 scale, with higher values indicating increased significance.
(B) Quantitative PCR validation of the indicated mRNA steady state levels in the livers of WT and Tg(fabp10a: foxn3,EGFP)z106 adult livers. Mean ± s. e. m. values are shown. *P <0.05; two-tailed Student’s t-test (n = 5). slc2a2, solute carrier family 2 (facilitated glucose transporter), member 2.
(C) MYC transcript abundance in cryopreserved human hepatocytes. Horizontal lines indicate the median value. *P <0.05; two-tailed Student’s t-test.
(D, E) The membrane shown in Figure 1E was immunoblotted with anti-MYC IgG and the density of the MYC band was normalized to the TUBB band densities; this is the same blot as in Figure 1E. Horizontal lines indicate the median value. *P = 0.019 by Mann-Whitney Rank Sum Test after excluding an outlier (determined using the Grub’s test) from the A∣A genotype values.
(F) Structure of the zebrafish mycb gene. A Forkhead binding site and a MYC binding site (E box) are located distal to the 3′-UTR. The target PCR product for the ChIP assay is underlined.
(G) Quantitative PCR analysis following ChIP with the indicated antibodies was performed in WT and Tg(fabp10a:FOXN3,EGFP)z107 livers. Fold enrichment was calculated relative to the mouse IgG levels. Mean ± s. e. m. values are shown. See also Table S1 and Figure S2.

