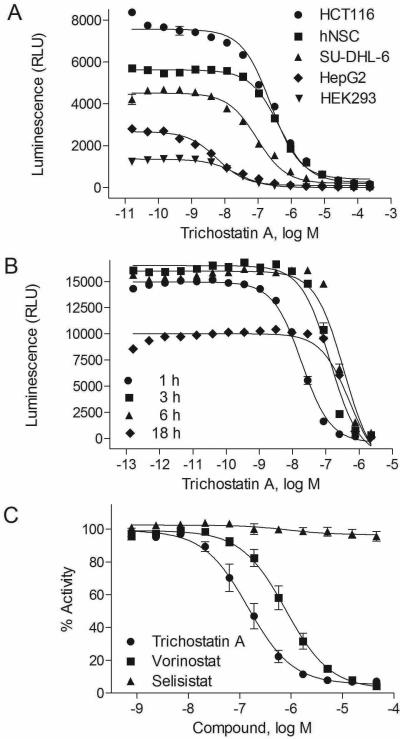
Figure 1. Optimization and validation of the histone deacetylase (HDAC)-Glo I/II assay in 1536-well format.
A. Optimal concentration titration of HDAC-Glo I/II activity in HCT116 (average IC50 of 0.25 μM), HEK293 (average IC50 of 0.09 μM), HepG2 (average IC50 of 0.05 μM), human neural stem cells (hNSC) (average IC50 of 0.44 μM), and SU-DHL-6 (average IC50 of 0.10 μM) treated with trichostatin A. B. Time course of HDAC-Glo I/II activity in HCT116 cells after treatment of trichostatin A, with average IC50s of 0.02 μM for 1 hour, 0.11 μM for 3 hours, 0.22 μM for 6 hours, and 0.29 μM for 18 hours, respectively. C. Assay selectivity as shown as concentration-response curves of HCT116 cells treated with two known HDAC inhibitors (average IC50s of 0.77 μM for vorinostat/suberoylanilide hydroxamic acid (SAHA) and 0.07 μM for trichostatin A) and a sirtuin (SIRT) inhibitor (selistat, inactive). Each data point was presented as mean ± SEM from three replicates.

