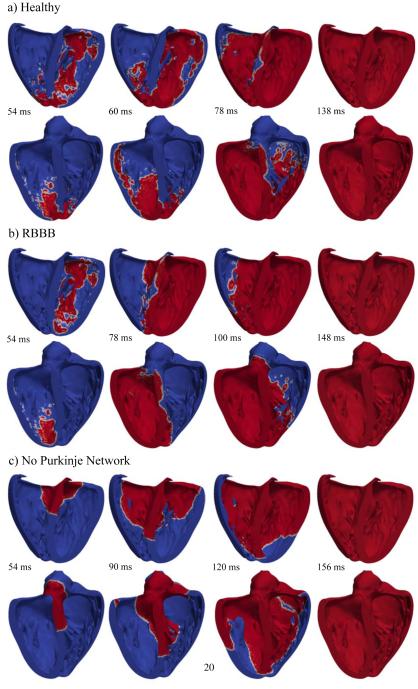
Figure 9.
Activation sequences of the left and right ventricles. (a) Simulation with Purkinje network under physiological healthy conditions; (b) Simulation with Purkinjenetwork under pathological conditions of right bundle branch block; (c) Simulation without Purkinjenetwork. The color code indicates the transmembrane potential φ; red corresponds to the excited state of φ= +20 mV and blue to the relaxed state of φ= −80 mV.

