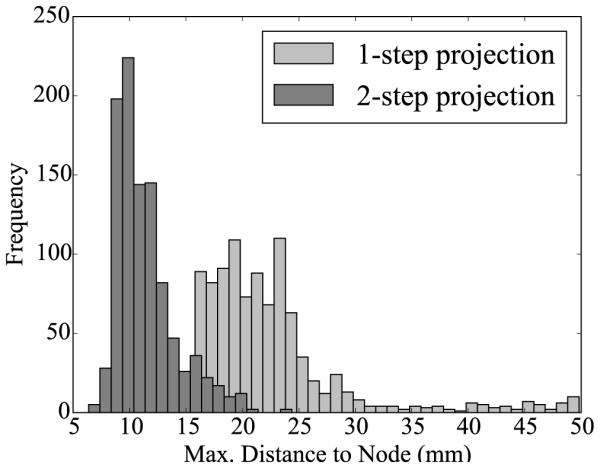
Figure 7.

Histograms of Monte Carlo simulations for the one-step and two-step projection methods. The maximum distance from a node in the mesh to a node on the surface is plotted for sets of 1,000 randomly generated networks. The maximum distance is smaller for the two-step projection method, implying that the surface area is better covered by fibers by the two-step projection method.
