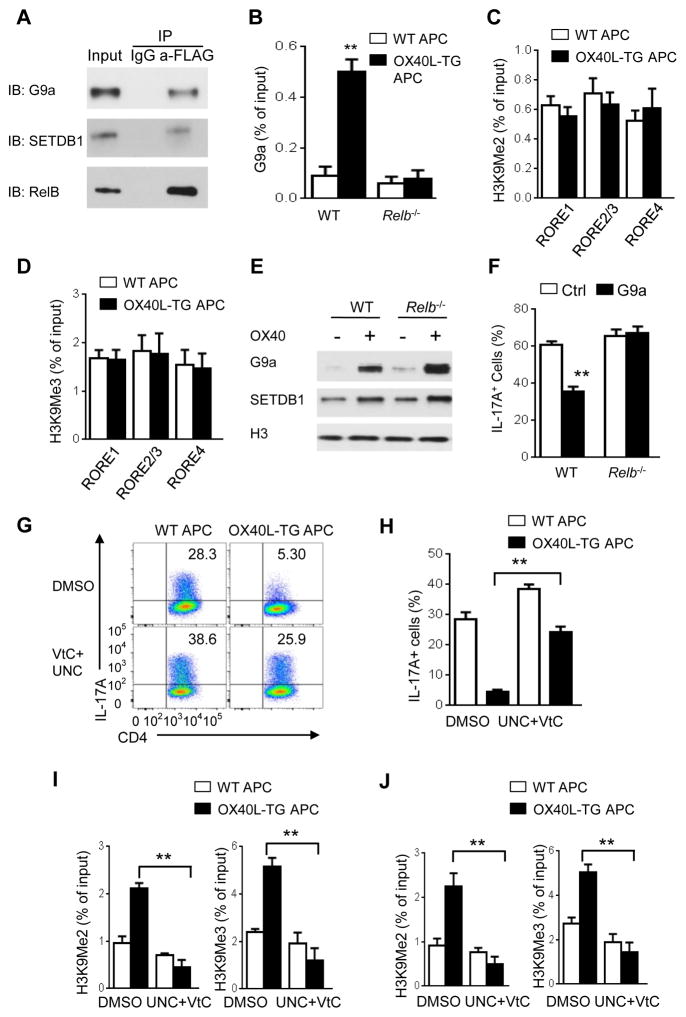
Figure 6. Inhibition of G9a and SETDB1 rescues Th17 cells from OX40-mediated suppression.
(A) Immunoblot (IB) analysis of G9a and SETDB1 in cell lysate immunoprecipitated with anti-FLAG (RelB) or IgG from WT CD4+ T cells transduced with retrovirus expressing FLAG-RelB and cultured for 48 h under Th17-polarizing conditions. Data are representative of three independent experiments.
(B) ChIP analysis of the enrichment of G9a in the Il17a promoter region in WT and Relb−/− CD4+ T cells activated as in Figure 6C.
(C and D) ChIP assays of H3K9me2 (C) and H3K9Me3 (D) at the Il17a locus by ChIP–qPCR in Relb−/− CD4+ T cells activated under Th17-polarizing conditions for 3 days. Data are presented as mean ± SD (n=3).
(E) Immunoblot analysis off G9a and SETDB1expression in the nucleus of WT or Relb−/− CD4+ T cells activated as in Figure 2B for 48 h. Data are representative of two independent experiments.
(F) Induction of Th17 cells from WT or Relb−/− CD4+ T cells transduced with retrovirus expressing G9a and cultured with WT APCs under Th17-polarizing conditions for 3 days. Graphs depict Mean ± SEM of 4 experiments with triplicate cultures. ** p <0.01.
(G and H) Induction of Th17 cells from WT naive CD4+ T cells activated for 3 days under Th17-polarizing conditions and treated with G9a inhibitor UNC0646 (500 nM) and Vitamin C (50ug/ml) or DMSO (G). Graphs in (H) depict Mean ± SEM of 5 experiments with triplicate cultures. ** p <0.01.
(I and J) ChIP analysis of H3K9Me2 and H3K9Me3 at RORγt binding sites RORE1 (I) and RORE2/3 (J) in the Il17a promoter region in WT CD4+ T cells activated and treated as in (C) for 3 days. Data are presented as mean ± SD (n=3). ** p <0.01.

