
Figure 9.
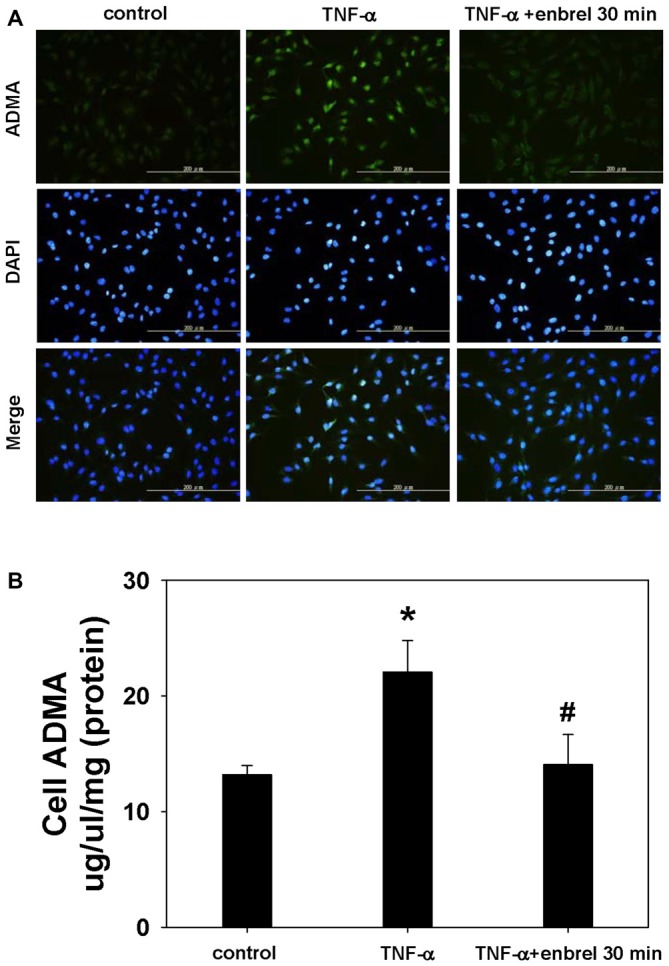
Staining of ADMA in intact cells and visualization by fluorescence microscopy. (A) Representative images acquired from cultures of rat astrocyte C6 cell lines. ADMA staining is shown in the upper panel. DNA was stained with 4′,6-diamidino-2-phenylindole (DAPI; middle panels). Merged images are shown in the lower panels. (B) The concentration of ADMA in whole cell lysates. One-way ANOVA followed by Tukey HSD post hoc test was used to assess the statistically significances among groups, *P < 0.05 vs. control; #P < 0.05 vs. TNF-α incubated only.