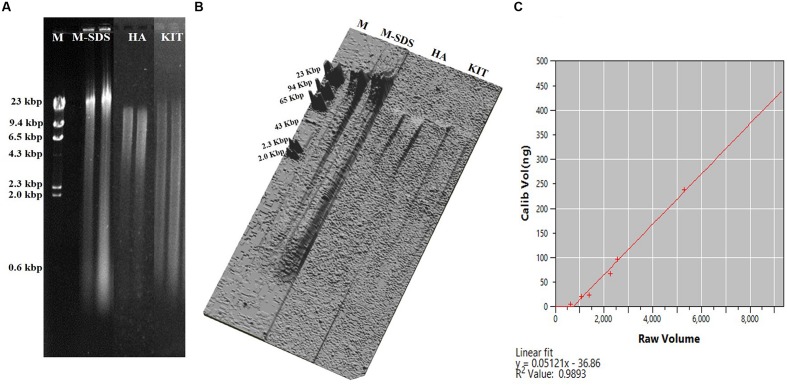
FIGURE 2.
(A) Agarose gel electrophoresis of the recovered DNA from the Guaymas Basin sediment sample. Equal amount of sample (0.3 g) were extracted with three methods. The loading volume of the recovered DNA was 1 μL. M indicates Lambda DNA/HindIII Marker 2 (Thermo Fisher Scientific, USA). (B) Representation of DNA band intensity (A) as plotted in three dimensional image. (C) Standard curve for measuring the DNA concentration using CLIQS 1D Pro software as determined by the DNA band intensity on the agarose gel.

