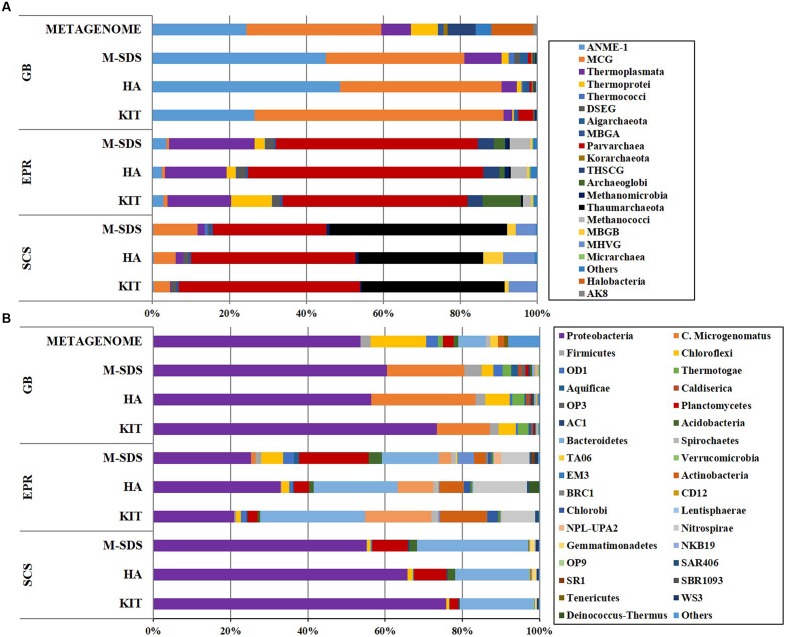
FIGURE 4.
(A) Archaeal (class level) and (B) bacterial (phylum level) taxonomic diversity of microbial communities in three seafloor samples obtained by three different DNA extraction methods. Color bars indicate the percentage of the designated group within each sample. Only >0.1% abundance are listed. The remaining sequences are grouped to “Others.”

