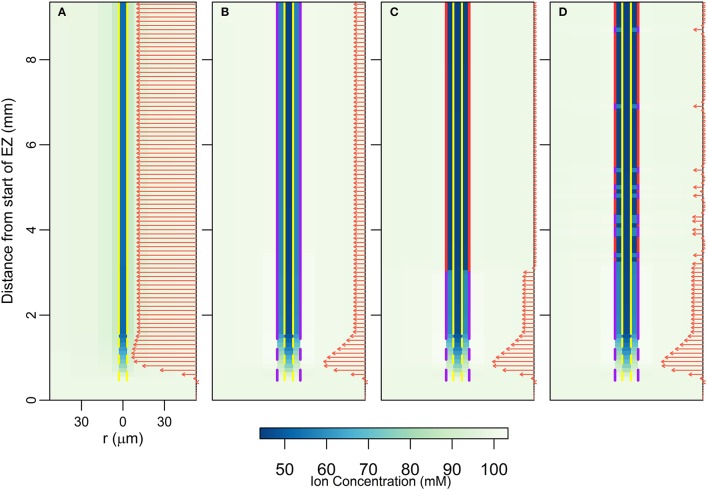
Figure 2.
Plots of steady state ion concentrations (colormaps) and ion fluxes (arrows) for four different root structures: (A) no endodermal barriers present, (B) CS present, (C) CS and SL present, (D) CS and SL with passage cells present. Yellow vertical lines show the presence of functional xylem with dashed lines near the root tip indicating the gradual increase in conductivity as the xylem develops. Purple vertical lines represent the presence of the CS; dashed lines near the root tip indicate the gradual appearance of the barrier. Red vertical lines show the location of the SL, with gaps identifying the location of passage cells. The arrows show the magnitude of net radial solute flux across the root surface (in mol s−1), with the same scale used across all four subfigures. These arrows are also indicative of the corresponding water flow rates. All simulations assume 100 mM of 2 monovalent cations and 2 monovalent anions in the soil (e.g., 100 mM NaCl and 100 mM KNO3). All ions are assumed to have identical transport properties and the transport parameters used are provided in Table 1. Refer to Section 2.3 for an explanation of the simulation of the endodermal barriers and xylem development. These simulations were carried out using Pb = −0.5 MPa.

