
Figure 3.
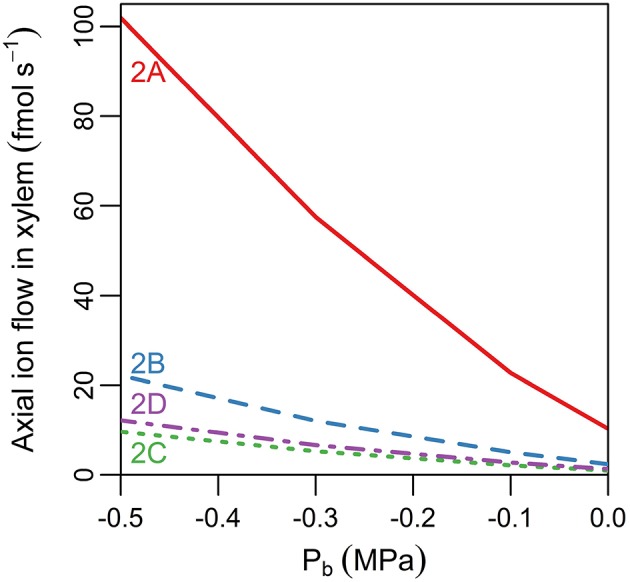
Line plot showing the steady state axial flux of ions out of the top of the root xylem as a function of pressure at the top of the root, Pb (representing different rates of transpiration), and of the barriers present in the endodermis (different line types). The scenarios considered are: no endodermal barriers (solid red line); CS only (dashed blue line); both CS and SL present with no passage cells (green dotted line); and both CS and SL with passage cells present (purple dot-dashed line). The labels indicate the corresponding scenarios in Figure 2. The axial fluxes into the xylem compartment three cells down from the top of the root were used to minimize the influence of the flux boundary conditions chosen at the top of the root. The solute fluxes shown are also indicative of the corresponding water flow rates. All simulations assume 100 mM of 2 monovalent cations and 2 monovalent anions in the soil. All ions are assumed to have identical transport properties and the transport parameters used in the simulations are provided in Table 1.