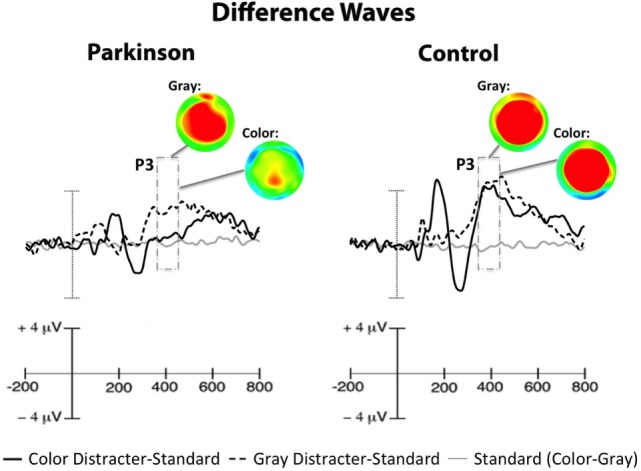
Figure 3.

Centrofrontal difference waves, which show amplitude contrasts for distracter-standard conditions (dark and dotted lines) and standard stimuli taken from color and gray distracter blocks (gray line). ERPs to standard stimuli did not differ as a function of distracter color (flat line), so effects seen in distracter-standard difference waves were attributable to the distracters. Scalp maps illustrate distracter-standard P3 difference waves (i.e., P3a), revealing a centrofrontal reduction in color-related distracter processing in PD patients. Note: voltage ranges for scalp maps were identical for each group (−4 to +2 μV).
