
Figure 3.
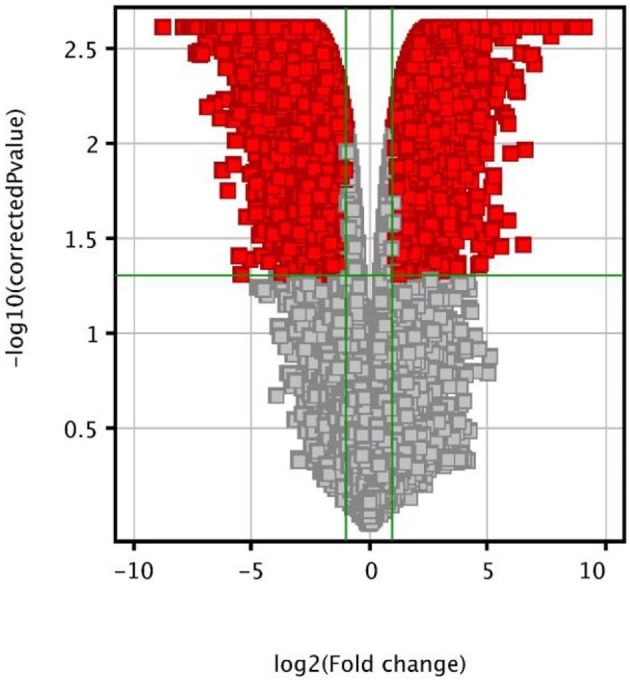
Volcano plot showing the distribution of the gene expression fold changes of the T3MCTSs compared with CMCTSs. Genes with absolute fold change ≥2 and p < 0.05 are indicated in red.
Official websites use .gov
A
.gov website belongs to an official
government organization in the United States.
Secure .gov websites use HTTPS
A lock (
) or https:// means you've safely
connected to the .gov website. Share sensitive
information only on official, secure websites.
Volcano plot showing the distribution of the gene expression fold changes of the T3MCTSs compared with CMCTSs. Genes with absolute fold change ≥2 and p < 0.05 are indicated in red.