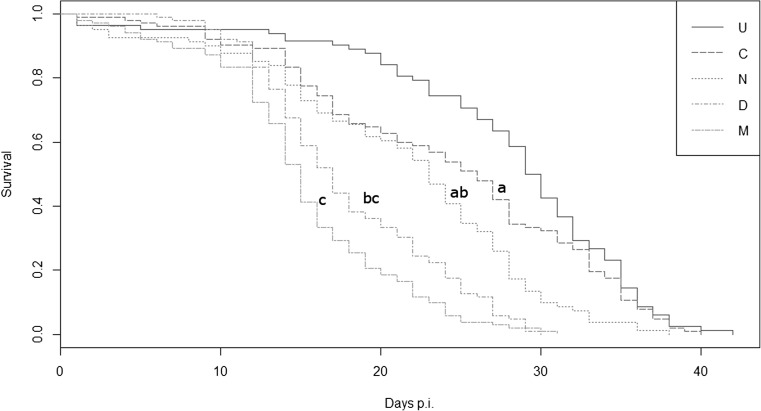
Fig. 1.
Fitted Cox proportional hazard survival curves in days post-infection (p.i.). Treatments tested: U = untreated, C = control, N = N. ceranae, D = DWV, M = mix (DWV + N. ceranae). Different lowercase letters indicate significant difference at p < 0.05 (post hoc pairwise planned comparisons, Bonferroni corrected). Manipulation per se did not significantly reduce survival of bees (U vs. C: p > 0.1; comparison not shown in the figure). Note that survival plots are for visualisation only as they do not incorporate random effects (replicate cages)

