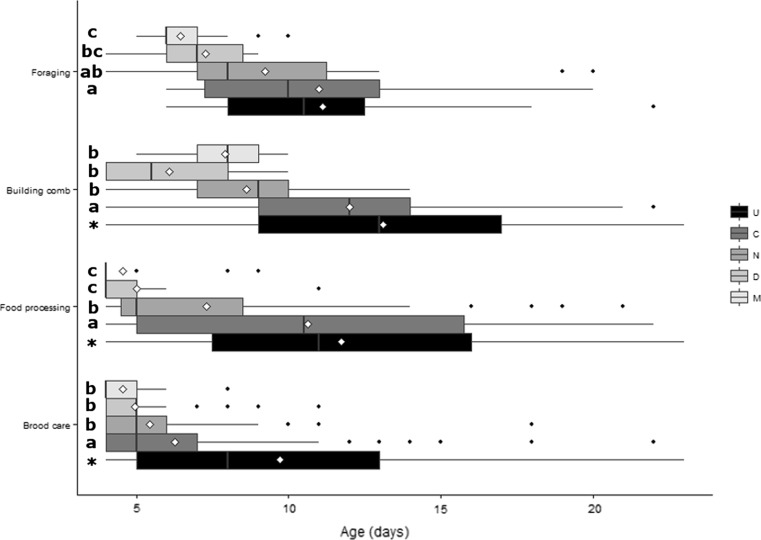
Fig. 3.
Box-plot showing the median age of bees performing tasks related to temporal patterns by treatment group (U = untreated, C = control, N = N. ceranae, D = DWV, M = DWV + N. ceranae). Diamonds indicate the mean of each group, while black dots indicate outliers. For ‘brood care’, the tasks HEC and Hlarv were combined; for ‘food processing’, HN and HP were combined; and for ‘foraging’, AD, PD and CP were combined (for abbreviations of behaviours, see Table 1). Different lowercase letters indicate significant differences at p < 0.05. Asterisks (*) indicate significant difference between untreated (U) and control (C) groups at p < 0.05. Pairwise planned comparisons (see “Material and methods” section) were performed within each behavioural task

