Figure 2.
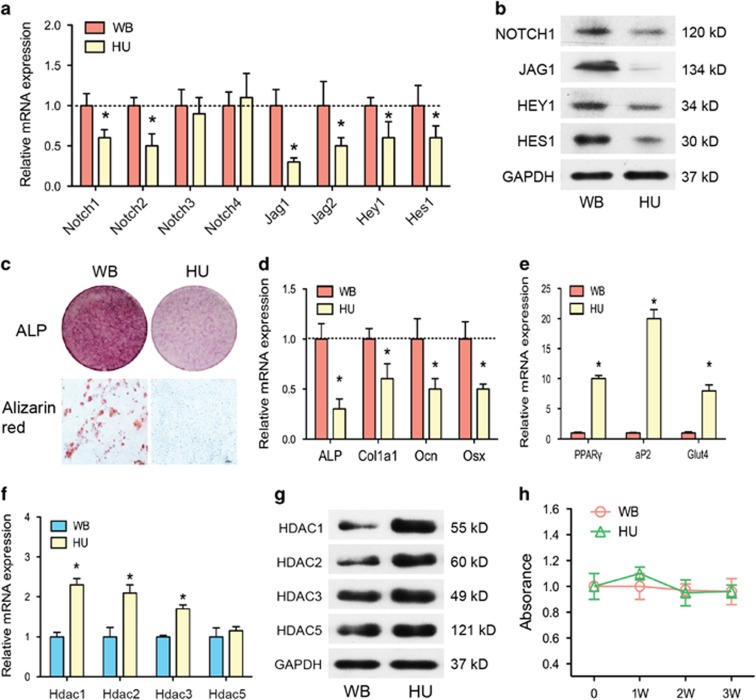
Notch signaling pathways and osteogenic differentiation were impaired in BMSCs of HU mice. (a) qRT-PCR analysis of Notch1–4, Jag1, Jag2, Hes1, and Hey1 mRNA levels in BMSCs of WB and HU mice. (b) Western blotting analysis of NOTCH1, JAG1, HES1, and HEY1 protein levels in BMSCs of WB and HU mice. (c) Representative images of ALP staining and Alizarin red staining of BMSCs from WB and HU mice. Scale bar, 100 μm. (d) qRT-PCR analysis of osteogenic differentiation markers Alp, Col1a1, Ocn, and Osx in BMSCs of WB and HU mice. (e) qRT-PCR analysis of adipogenic differentiation markers PPARγ, aP2, and Glut4 in BMSCs of WB and HU mice. (f) qRT-PCR analysis and (g) western blotting analysis of HDACs in BMSCs of WB and HU mice. GAPDH was used as an internal control. (h) Cell viability was examined by MTT assay between BMSCs of WB and HU mice. All results are representative of at least three independent experiments. All the staining data were confirmed by three repeated tests. Data were mean±S.D., *P<0.01. All P-values are based on Student's t-test

