Figure 1.
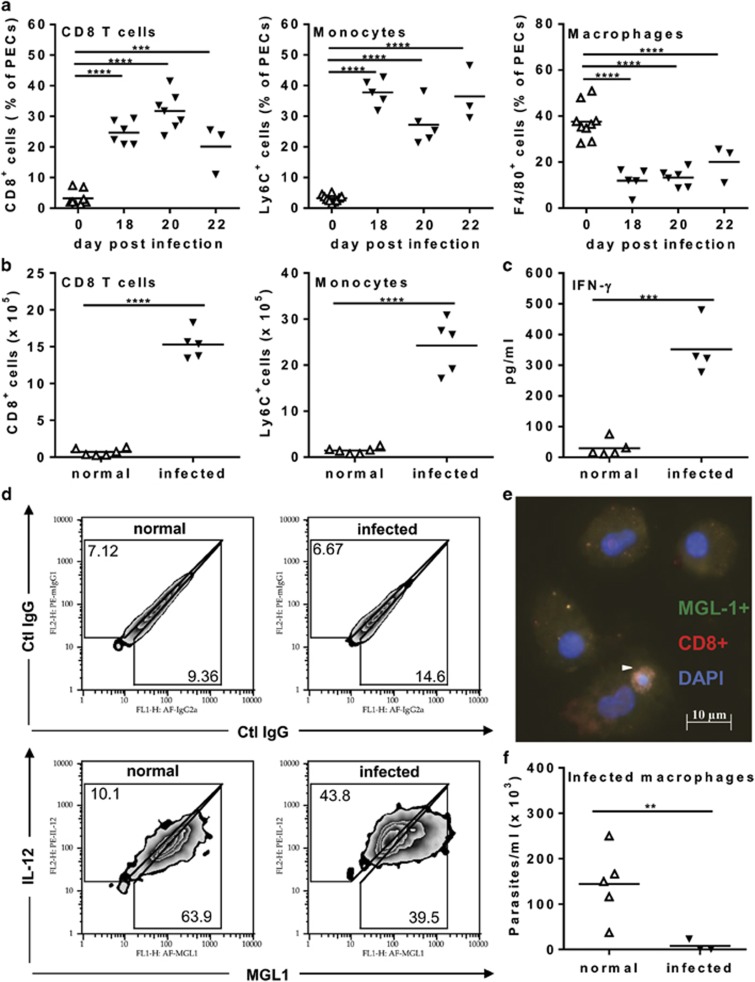
CD8 T cells and monocyte-derived macrophages in acute T. cruzi infection. (a) Percentages of CD8+ T cells, Ly6C+ monocytes, and F4/80+ macrophages in PECs from T. cruzi-infected mice compared with PECs from uninfected (d 0) mice. (b) Absolute numbers of CD8+ T cells and Ly6C+ monocytes and (c) IFN-γ in peritoneal exudates from normal and infected (18 dpi) mice. (d) Expression of MGL1 (M2) and IL-12p35 (M1) markers (as well as the respective control mAbs, upper panels) in F4/80+ macrophages from normal or infected (18 dpi) mice cultured during 48 h. (e) Image depicts PECs from infected (18 dpi) mice and represents results of three independent experiments. T cells were stained with anti-CD8 (PE, red, arrow head), macrophages stained with anti-MGL1 (Alexa Fluor 488, green), and nuclei marked with DAPI (blue). (f) Parasite burden as trypomastigotes released by macrophages from normal or infected (18 dpi) mice cultured during 3 weeks after infection with metacyclic parasites. In (a, b, c, and f), each symbol represents an individual normal (Δ) or infected (▾) mouse. Significant differences between normal (N=5–10) and infected (N=3–7) mice are indicated (*), as analyzed by analysis of variance (ANOVA) with Dunnett's post-test (a) and t-test (b, c, and f). Graphs depicted in (d) are representative of at least three independent experiments with pools of cells from infected (18 dpi) mice, cultured in two to four technical replicates. IL, interleukin

