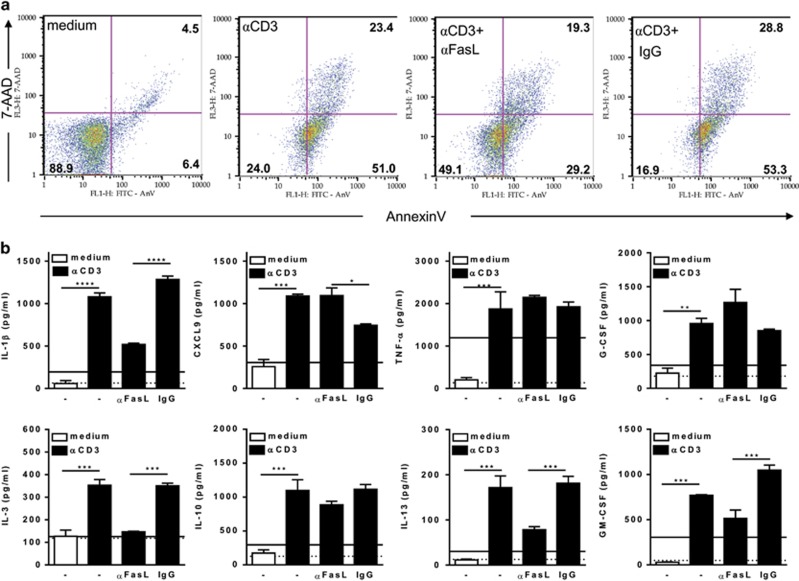
Figure 5.
Apoptosis of CD8 T cells correlates with M2-cytokine responses. (a and b) Peritoneal macrophages and splenic CD8 T cells from infected mice were stimulated or not with soluble anti-CD3 in the presence of interleukin-2 (IL-2). Anti-CD3-activated cocultures were treated or not with anti-FasL or control immunoglobulin G (IgG). After 48 h, culture supernatants were collected for evaluation of cytokine responses, as assessed by enzyme-linked immunosorbent assay (ELISA) (b). CD8 T cells were analyzed for annexin V/7-AAD (7-aminoactinomycin D) staining (a). (b) Full lines stand for cytokines produced by stimulated CD8 T cells and dotted lines represent cytokine responses by macrophages. Data represents mean and S.E.M. of three to four technical replicates in at least three independent experiments. Significant differences between treatments are indicated (*), as analyzed by analysis of variance (ANOVA) with Bonferroni post-test

