
Figure 4.
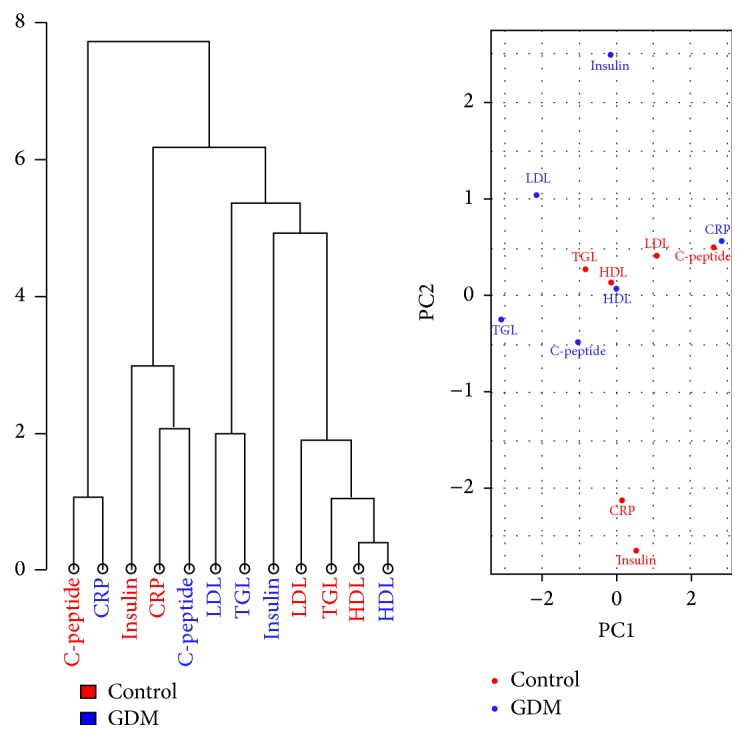
Hierarchical Clustering and Principal Component Analysis for both glycemic and lipid parameters. Both graphs showa clear separation between the glycemic and lipid parameters in both GDM group and control. However, there is an exception to this in the case of HDL.