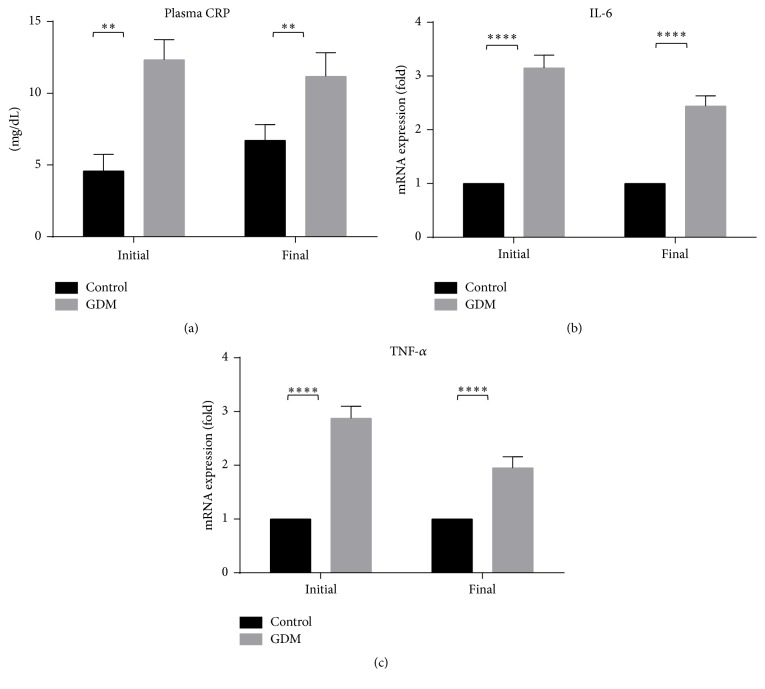
Figure 6.
Plasma CRP and expression of inflammatory genes of control and GDM rats. Level of plasma CRP at initial and final stages was high in GDM group compared to control group. mRNA expressions of IL-6 and TNF-α are shown. mRNA levels of inflammatory genes show that both IL-6 and TNF-α were higher in GDM group compared to control. Data shown as mean ± SD of four rats. For each parameter, a value with the asterisk signifies P < 0.05 and the absence of asterisk indicates otherwise. P value less than 0.01 was designated with two (∗∗) asterisks, and P value less than 0.0001 was designated with four (∗∗∗∗) asterisks.

