Figure 5.
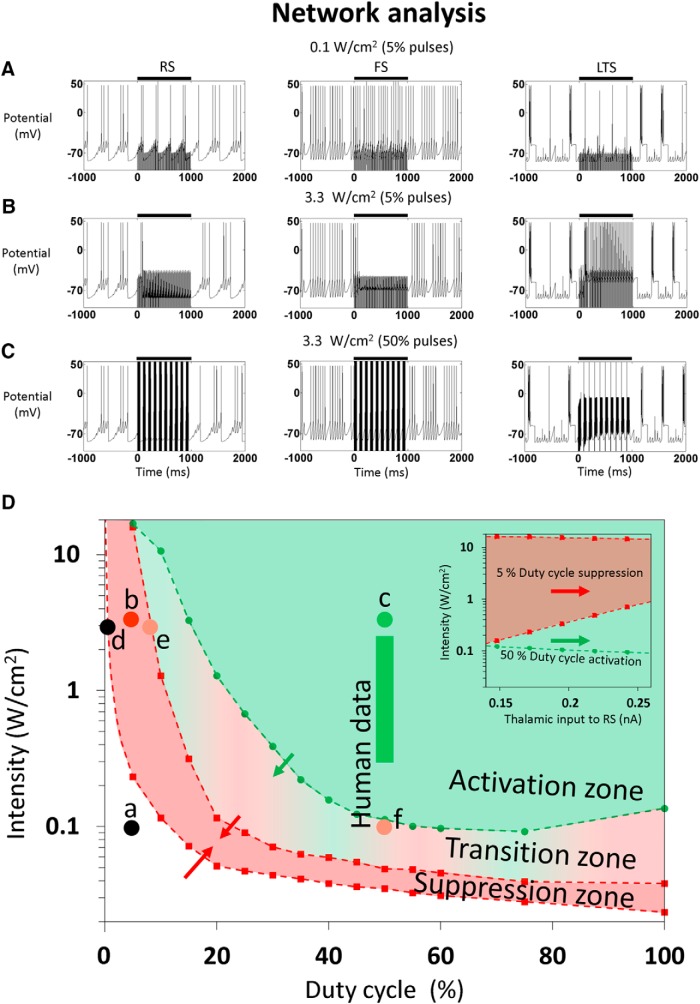
Simplified cortical NICE-network responses to different US waveforms and intensities. The US stimuli (US frequency and duration: 0.69 MHz and 1 s) are indicated by black bars (A–C). A, For a stimulus duty-cycle of 5% and 0.1 W/cm2 intensity (PRF, 100 Hz) no significant response to US is observed. B, Increasing the intensity to 3.3 W/cm2 causes FS and RS activity suppression due to strong LTS activation (∼40 Hz). C, Increasing the duty-cycle to 50% (PRF, 10 Hz) leads to high frequency activation of the RS and FS neurons, unsuppressed by the weaker LTS firing (only at the beginning of each US pulse). D, Phase plane diagram for the network responses to US with varying duty-cycle and intensity (PRF, 100 Hz). Marks a–c indicate the conditions of the respective simulations (matching the experimental observations of Yoo et al. (2011a) and marks d, e, indicate parameters from Kim et al. (2015) where the experimental responses were no longer suppressive. The vertical green bar represent human primary somatosensory cortex stimulation parameters used to evoke tactile sensations (Lee et al., 2015); f marks the only case where no response was observed. The green and red arrows and the inset depict the effect of increased thalamic input on the activation and suppression thresholds.

