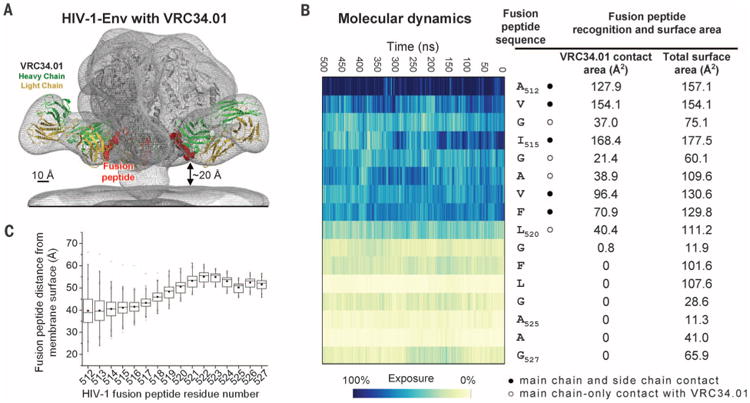
Fig. 4. Fusion peptide accessibility and position relative to viral membrane.

(A) Superposed EM map of the BG505 SOSIP.664-VRC34.01 complex and that of HIV-1 Env trimers reconstructed from their membrane-bound context (EMDB 5019 and 5022) (gray meshes). Fab VRC34.01 bound to BG505 SOSIP.664, as extracted from the ternary complex crystal structure, was docked and shown in ribbon representation with VRC34.01-contacting fusion peptide (512 to 519) in red spheres. (B) Fusion peptide in the context of a molecular dynamic simulation of fully glycosylated HIV-1 Env trimer. The degree of solvent exposure of each residue in the fusion peptide is depicted on a blue-to-yellow color scale, with antibody-contact surface and total surface area shown for context. (C) Range of distance to the viral membrane for each residue of the HIV-1 fusion peptide over the course of the molecular dynamics simulation. The median distance for each residue is represented as a horizontal line in each box. The mean value is represented as a small filled box. The height of each box is set by the 25th and 75th interquartile range, and the whiskers are determined by the 5th and 95th percentiles. The minimum and maximum distances for each residue over the length of the simulation is represented as “x.” See fig. S23 for an analysis of immune recognition of fusion peptide in other type 1 viral fusion machines.
