Figure 4.

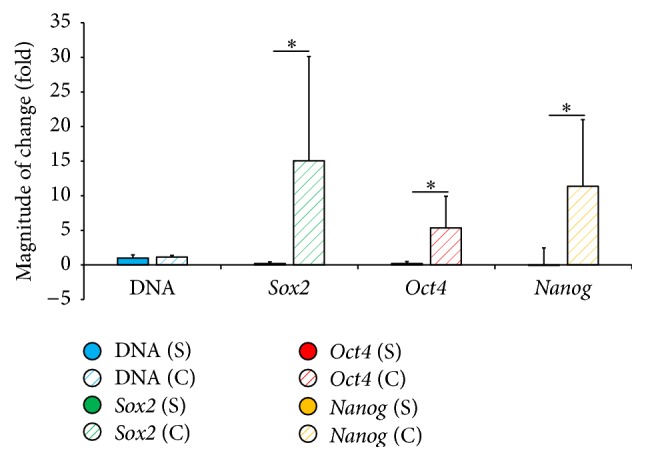
Magnitude of change (mean ± SD) in DNA content and gene expression within each group between day 3 and day 7. Cells were cultured under standard conditions (S) or conditioned on chitosan (C) under hypoxia. ∗ denotes p value < 0.05.

Magnitude of change (mean ± SD) in DNA content and gene expression within each group between day 3 and day 7. Cells were cultured under standard conditions (S) or conditioned on chitosan (C) under hypoxia. ∗ denotes p value < 0.05.