
Figure 2.
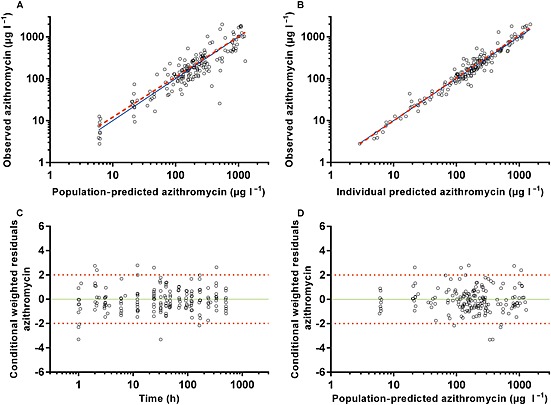
Diagnostic plots of the final azithromycin population pharmacokinetic model. (A) Observed vs. population‐predicted plasma concentration. (B) Observed vs. individual predicted plasma concentrations. (C) Conditional weighted residuals (CWRES) vs. time. (D) CWRES vs. population‐predicted concentrations. Solid lines represent lines of identity in A and B, and zero conditional residuals in C and D. Dashed lines represent lines of best fit in A and B, and dotted lines represent ±2 standard deviations in C and D