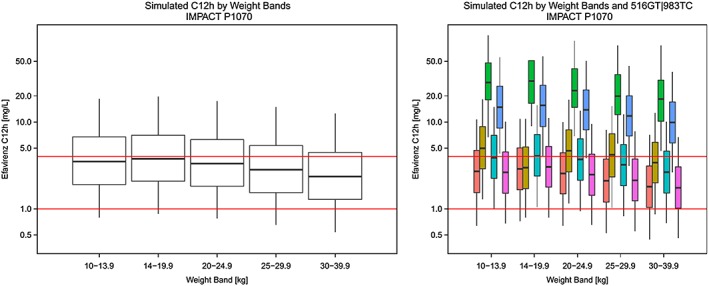
Figure 3.

Simulated mid‐dose concentrations across weight‐bands (left) and by different 516GT|983TC genotypes (right) based on dose recommendations tested in IMPACT study P1070 applied to our population. Red horizontal lines correspond to efavirenz concentrations of 1 mg l−1 and 4 mg l−1
3. Breaks in the percentile plot correspond to 25th, median and 75th percentile and whiskers correspond to 5th and 95th percentile of the simulated data. CYP2B6 ( ) 516GG|983TT; (
 ) 516GG|983TC; (
 ) 516GG|983CC; (
 ) 516GT|983TT; (
 ) 516GT|983TC; (
 ) 516TT|983TT
