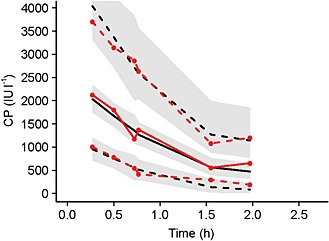
Figure 1.

Visual predictive check plot for the final pharmacokinetic model. Median of observed (unbroken red line, closed circles) and predicted (unbroken black line) date are depicted. Also, 5th and 95th percentiles of observed (dashed red lines, closed circles and predicted (dashed black lines) data are shown. Grey bands are the 95% confidence intervals. CP, the plasma concentration of heparin in IU/L
