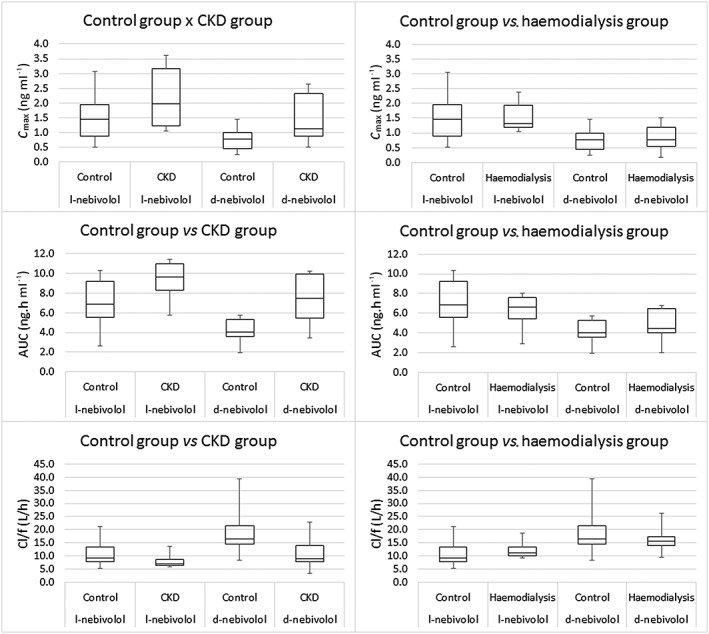
Figure 2.

Box plot comparing pharmacokinetic parameters (C max, AUC and oral clearance) of the l‐nebivolol and d‐nebivolol enantiomers between the control and CKD groups and between the control and haemodialysis groups. AUC, area under the concentration–time curve; CKD, chronic kidney disease; C max, maximal plasma concentration
