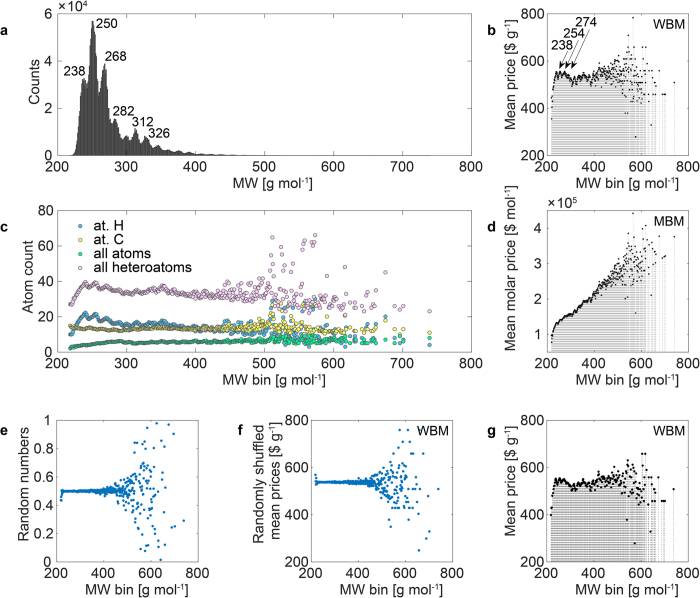
Figure 2. Binned MW statistics of chemical and economical data of the commercial library of ca. 2.2 mln compounds.
(a) Frequency distribution of MWs of the MW between 218.26 to 738.74 Da. The majority of the compounds are below a MW of 350 (96%) or 400 Da (99%). (b) Mean price (WBM) vs. MW bins. (c) Average atom counts vs. MW bins. (d) Mean price (MBM) vs. MW bins. (e) Random numbers (0–1) and (f) randomly shuffled mean WBM prices; plotted vs. MW bins. In (a–f) data were rendered at a single Da MW unit. (g) Mean price (WBM) vs. MW bins with a rendering resolution of 2 Da units. The comparison of the binning mode in (g vs. b) does not reveal any substantial changes in the range below ca. 400 Da.

